From “Icehouse” release on Openstack has been added monitoring physical devices. At this moment available only one inspector – SNMP Inspector. IPMI Inspector will be add soon.
1. SNMP data:
The SNMP Inspector monitors devices such as routers, switches etc. The basis for this is the Net-SNMP (snmpd) package. The SNMP Inspector supports such meters as:
- hardware.cpu – cpu stats, average value for CPU load (1, 5, 15 min)
- hardware.memory – memory stats, total and used
- hardware.disk – disk stats, list of all disks with total and used size for each
- hardware.network – network stats, list of IP’s with bandwidth, incoming, outgoing bytes and outgoing errors
The snmpd (a Linux Daemon) running on resources sends data to the SNMP Inspector directly.
- Install snmpd on your machine:
sudo apt-get install snmpd
- Change /etc/snmp/snmp.conf to make sure that snmpd daemon will be able get all necessary data:
rocommunity public
syslocation "ICClab"
syscontact serh@zhaw.ch
sysservices 79
proc
disk / 15%
disk /usr/backup 15%
- Download devstack:
git clone https://github.com/openstack-dev/devstack.git
- Enable ceilometer services in devstack/localrc:
# Enable the ceilometer metering services
enable_service ceilometer-acompute
ceilometer-acentral ceilometer-anotification
ceilometer-collector

# Enable the ceilometer api services
enable_service ceilometer-api
- Run devstack:
./devstack/stack.ch
- Add meters to /etc/ceilometer/pipeline.yaml:
   ...
    - name: meter_snmp
      interval: 600
      resources:
          - snmp://localhost
      meters:
          - "hardware.cpu*"
          - "hardware.memory*"
          - "hardware.disk*"
          - "hardware.network*"
      sinks:
          - meter_sink
    ...
- Rerun Ceilometer central agent
celometer-agent-central
now you can check meters: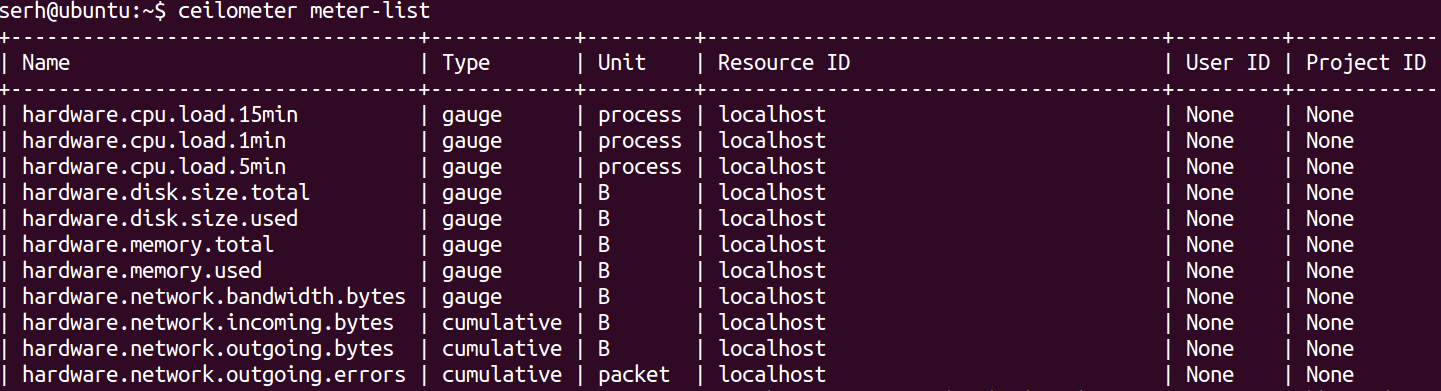 and samples:
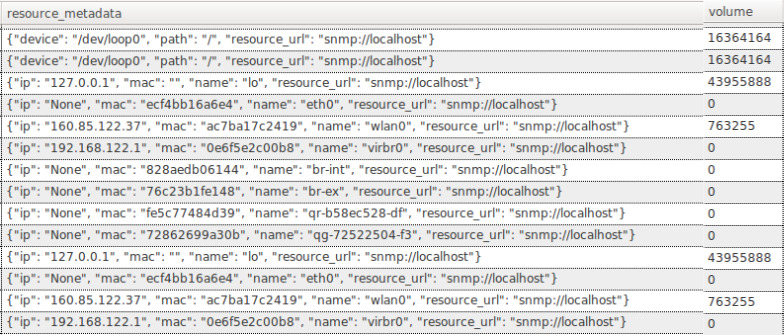
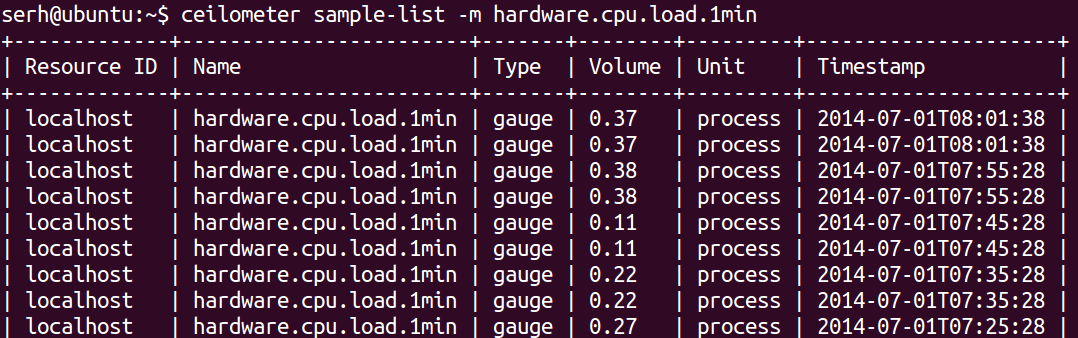 for such meters as hardware.disk and hardware.network in database has been stored additional information. IP, MAC, Name for network stats and device, path for disk.
2. IPMI Inspector
The IPMI Inspector monitors resource health data including:
- current.value – current value of fan speed, voltage, temperature
- max.value – maximum available value of stats
- min.value – minimum available value of stats
- current.status – status fan, voltage, temperature (ok/fail)
- Install ipmitool on your machine:
sudo apt-get install ipmitool
- Enable ironic services in devstack/localrc:
# Enable Ironic API and Ironic Conductor
enable_service ir-api
enable_service ir-cond
- Add line to /etc/ironic/ironic.conf:
send_sensor_data=true
- Rerun ironic conductor:
ironic-conductor
- Create node which support ipmi driver:
ironic node-create -d pxe_ipmitool -i ipmi_address=ip.mi.add.ress
-i ipmi_password=password -i ipmi_username=username
- Add meters to /etc/ceilometer/pipeline.yaml:
   ...
    - name: meter_ipmi
      interval: 600
      resources:
          - ipmi://ip.mi.add.ress
      meters:
          - "hardware.rpm*"
          - "hardware.volt*"
          - "hardware.degree*"
      sinks:
          - meter_sink
    ...
- Rerun Ceilometer central agent
celometer-agent-central
I have followed this article and some similar ones to a “T” with no success. When I run ‘ceilometer meter-list’, I get a table, but it does not include any of the hardware* metrics. If I run snmpwalk, I get results, etc. etc. so I know snmp is working, but Ceilometer is not able to pull in the metrics. I have confirmed that the pipeline.yaml file is correct, the snmpd.conf file is correct…what else am I missing?
Thanks,
Jeff
I think the article is not correct.
Good day!
The article is correct for Openstack Icehouse release for time when it was actually made.
Since then codebase, structure and the way Ceilometer collection is happening where changed.
Unfortunately now no one is not working on Cloud Monitoring initiative so tutorial can’t be updated regarding latest version.
You still can use it for Icehouse release thought.
best regards,
Oleksii