In one of our earlier blog posts, we described some test we performed to determine how server power consumption increases with compute load; this post is something of a variation on that post, but here we put the focus on work taking place within VMs rather than work taking place within the host OS. The point here is to understand how VM load and energy consumption correlate. Here we document the results obtained.
As with our previous work, we focused on compute bound loads – the focus in this test is on increasing the compute load on the servers by performing π calculations inside the VM. In this work, we used homogeneous VMs – all the VMs were of the same flavor with the following configuration 2GB RAM, 20GB local disk and 1 VCPU.
Each test was made in such way that the π calculation runs inside the VM for 30 minutes, after that the process is stopped and the VM sleeps for the next 30 minutes – which releases the core leaving it in an idle state. The test is performed continuously in an infinite loop.
In a common Openstack configuration, Ceilometer/Telemetry records the percentage of time the VM was active on the processor (CPU utilisation) every 10 minutes; these records are important to understand how cpu utilisation can be useful to estimate the total of energy consumed by a VM and also if it is possible to rely on these results.
Two variants of test were performed, one with a single VM performing the calculation and the other one with two VMs; the amount of energy consumed is recorded as well the CPU Utilization from ceilometer- and the time which each calculation starts. The graphs below show the results we obtained.

Figure 1 – Energy consumed by a single VM while performing the π calculation and in idle state.
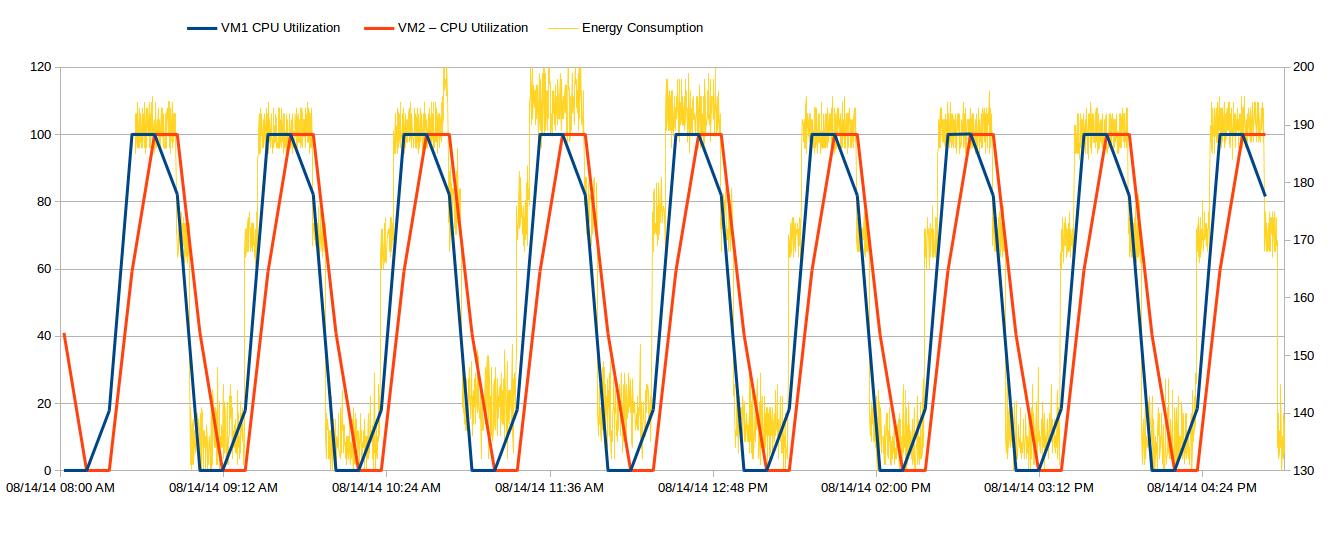
Figure 2 – Energy consumed by two VM while performing the π calculation and in idle state.
The energy consumed on the first variant of the test shows an increase of up to 25W between the VM in idle state and when it was performing the calculation. As the CPU utilisation recorded by Ceilometer is not synchronized with the start of the experiment there is a difference between it and π calculation.
The second variant of the test was performed with two VMs running the π calculation, again the start of the calculation is not synchronized so it is possible to see a difference in the beginning, when there is only VM running the code, and when the second VM starts to work in parallel.
The results show a quite predictable increase in energy consumption as the VMs become active. When one VM becomes active, there is a clear increase of 20-25W (both in the 1 VM and 2VM cases); when the second VM becomes active, there is a further increase of 10-20W in energy consumption.
What is quite interesting to note about these results is that we can use ceilometer measurements to construct a reasonably accurate estimator of the total energy consumption on the system. However, this result is far from general and significant further work is required to understand how well ceilometer measurements can be used to infer or estimate system energy consumption for more representative set of workloads.
If you’re interested in this topic, you may be interested in some of our other blog posts:
- A Web Application to Monitor and Understand Energy Consumption in an Openstack Cloud
- Collecting energy consumption data using Kwapi in Openstack
- Migration of Ceilometer Energy Consumption Data from Havana/MySQL to Icehouse/MongoDB