In some of our project work, we need to understand the energy consumption of our servers. One basic test we performed was to determine how server power consumption increases with load. In this blog post we document the results we obtained.
We focused on increasing the compute load on the machine by increasing the amount of simultaneous π calculations; the idea being to load up all the individual cores in the machine and monitor how energy consumption increases.
The machines we were using were IBM System x3550 M4 Servers. These had:
- 2 * Intel(R) Xeon(R) CPU E5-2640 @ 2.50GHz
- 192 GB RAM
- 1.5 TB HDD
These machines provide access to energy consumption information through the IBM AEM interface; this exposes how many Joules have been consumed by the machine since some start time and this can easily be converted to Watts over some timeframe. We find that these machines typically consume about 140W when idling.
Each experiment was designed such that a number of calculations of π are performed simultaneously. As the number of π calculations is increased, the number of active cores should increase and we can understand how loading up the cores increases energy consumption. In each case, the amount of energy consumed during the π calculations is obtained (by determining the difference in total Joules consumed between the start and the end of the experiment). The total runtime is recorded also, although generally this did not change so much as we only kept the number of calculations down to the number of available cores. We ran three variants of the tests which calculate π to different levels of precision. The first test calculates one hundred thousand numbers after the decimal point of the value of π, the second 200,000 and third 800,000. The results obtained are shown in the graphs below.
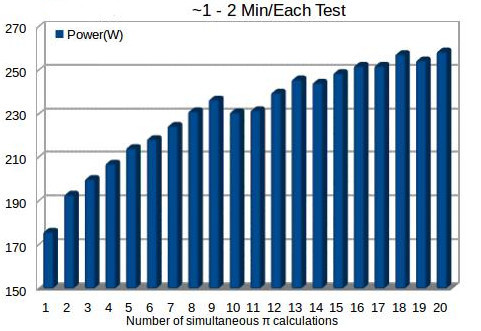
Figure 1: Variation in Server Energy Consumption with number of simultaneous π calculations – low precision
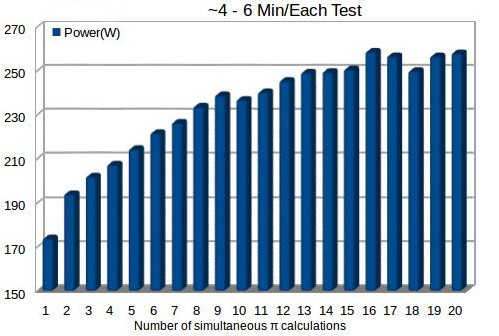
Figure 2: Variation in Server Energy Consumption with number of simultaneous π calculations – moderate precision
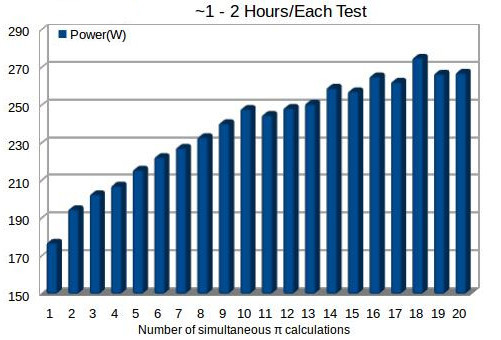
Figure 3: Variation in Server Energy Consumption with number of simultaneous π calculations – high precision
The three different experiments essentially show the same results: the power consumption varies from about 170W for one active core up to about 260 W for all cores active. Also, it can be seen that the energy consumption increases quite linearly as the number of calculations varies from about 2-10 and then flattens out a little. It is interesting to note that the baseline energy consumption – energy consumption in the idle state – accounts for about 50% of the total energy consumption when the machine is fully loaded.
The above tests were performed for a standard CentOS installation in which the processors are configured to deliver good performance. Modern OSs and processors support different configurations in which performance and energy consumption can be traded off – this is done via CPU frequency scaling which gives the OS control over how the CPU changes between states that have different power/performance characteristics. This is done using CPU governors which are essentially policies that govern these transitions. Examples of these policies include ondemand and powersave (ondemand essentially increases the CPU frequency if the processor load exceeds 95%, while powersave attempts to run the processor using the minimum available frequency). The concrete linux packages required to leverage this frequency scaling are cpupowerutils and the acpi-cpufreq kernel module.
To understand the impact of the CPU governor, we performed the same tests again, this time using the powersave governor rather than the ondemand governor (which is enabled by default). The results obtained are shown below.

Figure 4: Variation in Server Energy Consumption with number of simultaneous π calculations – low precision, powersave governor
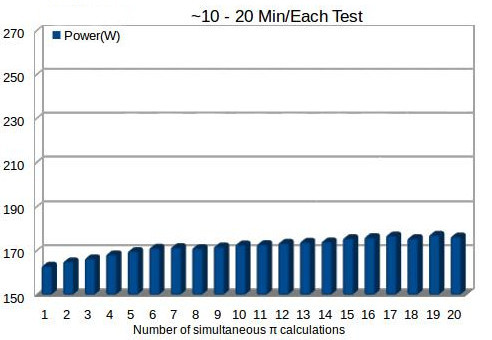
Figure 5: Variation in Server Energy Consumption with number of simultaneous π calculations – moderate precision, powersave governor

Figure 6: Variation in Server Energy Consumption with number of simultaneous π calculations – high precision, powersave governor
As with the first set of tests, the three sets of experiments showed essentially the same result. Clearly, the powersave governor has a very significant impact on the amount of energy consumed, with only very modest increases in energy consumption over the idle state (30-40W). This is in contrast to the ondemand case in which the difference could reach about 130W. Interestingly, in the powersave case, the idle power consumption accounts for a very large percentage of the total energy consumption. While the powersave governor results in a significant reduction in energy consumption; it also results in an increase in the amount of time taken to perform the calculations – generally, the time taken to perform the calculations almost doubled.
The main finding from the above experiments is that the baseline energy consumption accounts for a very significant percentage of the total energy consumption. This does give rise to questions around how significant the energy savings can be by performing software optimizations on today’s hardware. We will explore this in future work.
(Thanks to Bruno for generating the results documented here).