Introduction
Understanding how innovation works continues to be a significant agenda item for many researchers. Innovation, however, is generally recognised to be a complex and multi-dimensional phenomenon. Classificatory approaches have been used to provide conceptual frameworks for descriptive purposes and to help better understand innovation. Furthermore, classificatory approaches also attempt to elevate theorising from the specific and contextual to something more abstract and generalisable. In last decades, researchers have sought to explain variance in innovation activities and outcomes in terms of these different ‘types’ of innovation. The innovations are targeted to invent, or increment as we will see, new solutions that will be introduced in the market. Therefore in the methods for classifying the innovations are often utilized or customized to classify the products to specific market momentum or to classify the simply the markets. In the next sections, this part-1 blog introduces at high level the Gartner Market clock classification (for the products) and the innovation cube approach for the classification of the innovations. The second one is mainly a method to identify winning innovation strategies for the market and for the industries.
The part-2 of this blog will be dedicated to practical example to classify the ICT innovation and in particular the ecosystem of products dealing with virtualization an cloud computing.
1.0 Market Clock
The market introduction of new offers (product, service, application etc.., let’s call it products) often is associated with unknowns, uncertainties, and frequently unknowable risks.
The market analysts help to assess the target market sectors to reduce and clarify the uncertainties and mitigate the risks. There are several methodologies to classify the various phases crossed by a product during his market life. Generally, this includes an initial phase when the demand is initially “created” till the phasing-out of the product which correspond to end of its life in the market. A way to evaluate the position in the market is to analyze for example the relative sales associated. But in every phase that we are going to introduce there might be different ways to determine the market position, it depends on the side companies need to evaluate the product from a market point of view.
An initial concept of product lyfe cycle was developed by Theodore Levitt on 1965 . It is articulated in four intuitive stages: Stage-1 Market Development, Stage-2 Market Growth, Stage-3 Market Maturity and Stage-4 Market Decline when products begin to lose consumer appeal and sales drift downward. Another modern terminology adopts the following naming:customized, mass-customized, commoditized and disfavored.
There are of course situation where a product will directly jump in a particular phase due to its starting maturity (feature level and offer compared to the competitors) when created. Product strategies of provider normally define market introduction strategies based on indicators that may take into account the demand size in various life cycle stages. For example it can be decided to attack commodity market for desk-top storage.
Today, an interesting approach, which is more oriented to classify the maturity of existing products in the market, is the Market Clock .
Using this methodology you may find tables reporting products, in particular from the IT sector, classified with hours and minutes like 03:15, 06:30 etc.. and level of commodity.
This is also decision framework that helps IT and business leaders evaluate and prioritize their IT investments across items within any given technology asset portfolio. Although the mechanisms described here are focused on technology assets (products and services), the same approach can be applied to any class of business asset.
This Market Clock uses a clock-face metaphor to represent relative market time (see Figure 1). Each point positioned on the IT Market Clock represents an IT asset or asset class — for example, Desktop PCs, Fault-Tolerant Servers, 3G Wireless Networks, Packaged Maintenance and Support Services, or Learning Management Systems.
 Fig.1 – Source: Gartner (August 2012)
The quadrant allows classifying a product by its rotation (angle) which represent the maturity of the product and by the distance from the center which is the commoditization of the product. Typically, a new product will start from the center with a spiral shape to the last quadrant.
The Market clock defines from 00:00 to 3:00 the Advantage — new products with levels of demand low. It also indicates the possibility to take advantages for being first in the introduction in the market for the product.
From 3:00 to 6:00 Choice — This is the phase of highest demand growth, during which supply options should grow and prices fall at their fastest rate.
From 6:00 to 9:00 Cost — commoditization is at its highest level, and costs battles will be the strongest motivator.
From 9:00 to 12:00 Retirement — From 9:00 to 12:00, the market moves from mature mainstream status, through legacy and to “market end”. Procurement and operating costs will steadily rise, and enterprises should seek alternative approaches to fulfilling the business requirement.
Commoditization is shown on the IT Market Clock as the (radial) distance from the center of the clock: The further toward the outside of the clock an asset class is, the more commoditized it is. The hatched concentric circles help to relate the degrees of commoditization from one asset class to another. Commoditization is evaluated on a scale of four to 20, with 20 being the maximum level of commoditization. Commoditization is the sum of three measures: The level of standardization — (product can be interchanged ),The number of suppliers —( the range of choice available to buyers) and Access to appropriate skills (level of internal capability to use it).
For example, the following table shows how some vendor’s technologies are classified using the market clock approach.
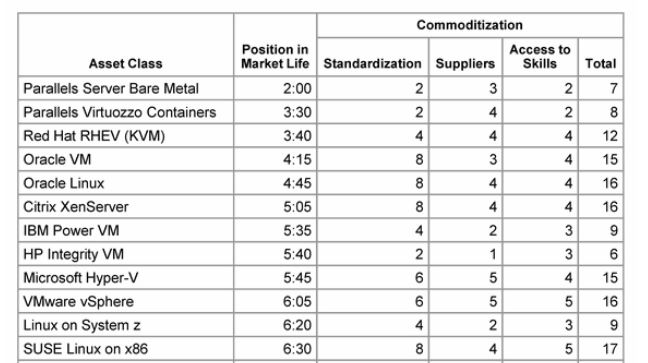
Table1 – example – Source: Gartner (September 2012)
There are relationships (Figure 2) between the market clock graph and well known Hype Cycles.
Gartner Hype Cycles highlight the expectations of technologies as they evolve following the progress of technologies from their first appearance to the maturity. The IT Market Clock highlights the progress of IT products and services from the time they first become viable to deploy and use to the time when they must be retired.
 Figure – 2 – Source: Gartner (August 2012)
2.0 Innovation Cube
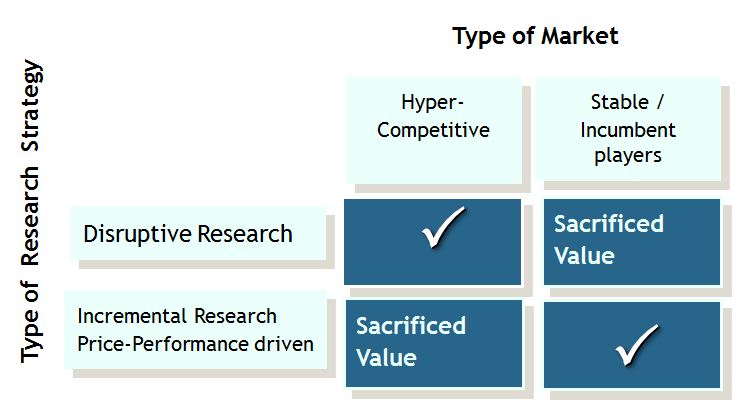
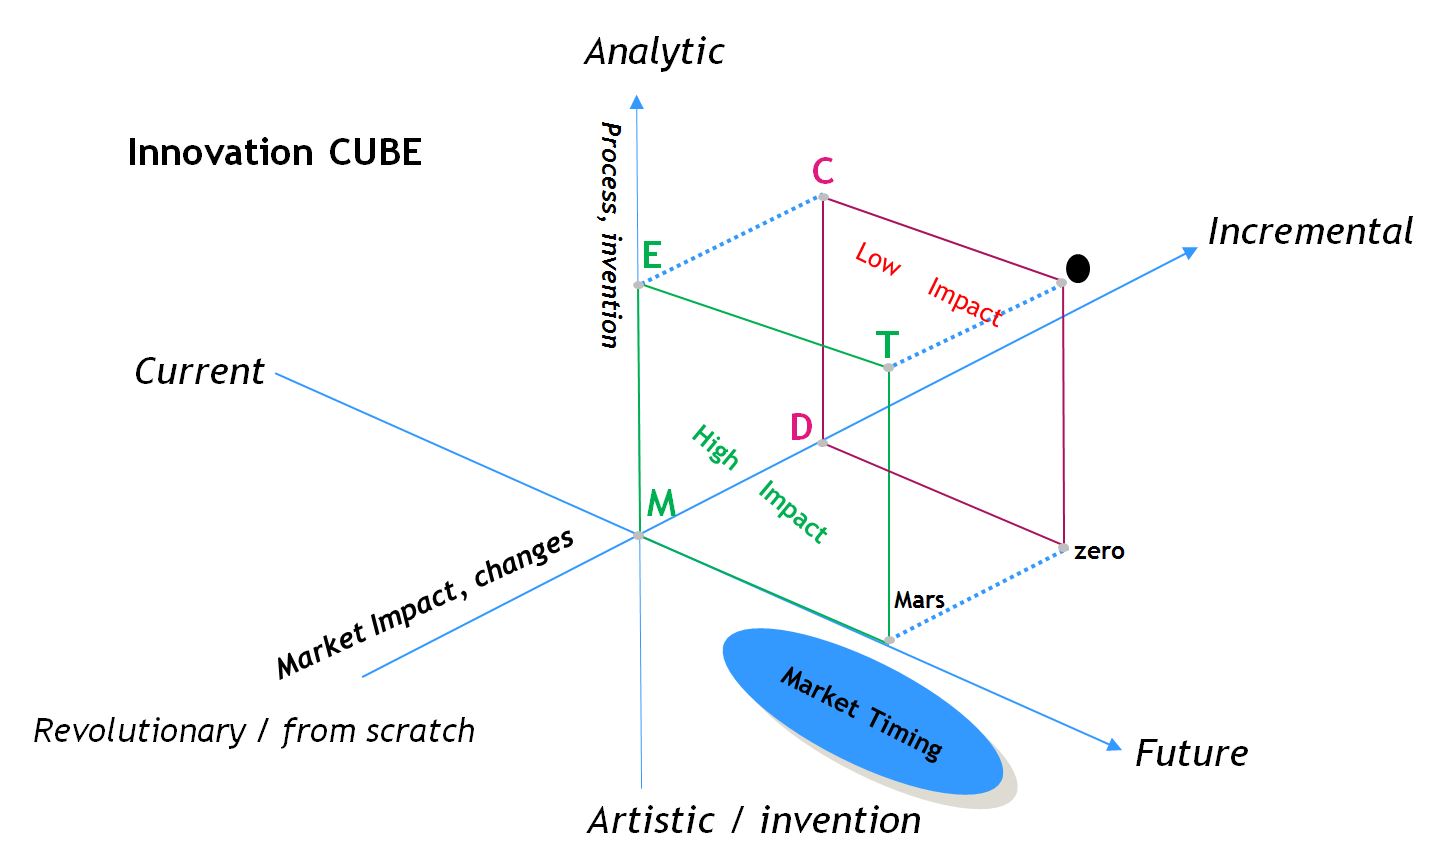
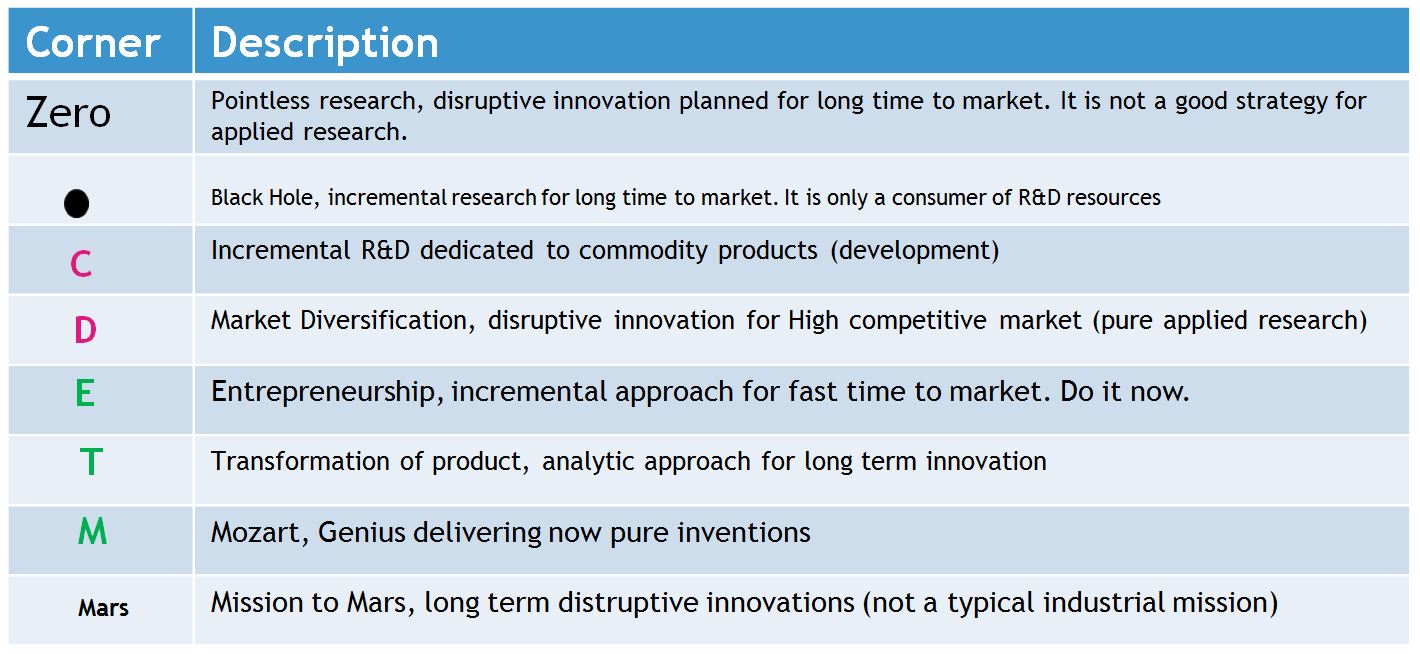
The approach introduced above is strongly oriented to the market classification of product and services, in other words to industrialised innovations. Before the development of a product and its creation, there is a phase where the product idea is incubated and developed. This phase normally ends with pre-competitive solutions and prototypes far from the final product configuration to be introduced in the market. During this period, specific strategy for the innovations is proposed. On this innovation side, as well, there are several methods to arrive at the classification of the innovation which is progressing in the Labs. An interesting approach is the innovation cube (page 7) which provides a method to classifies the innovations.
The graphical representation utilise a cube referred to three axes: X, Y and Z (Fig.3)
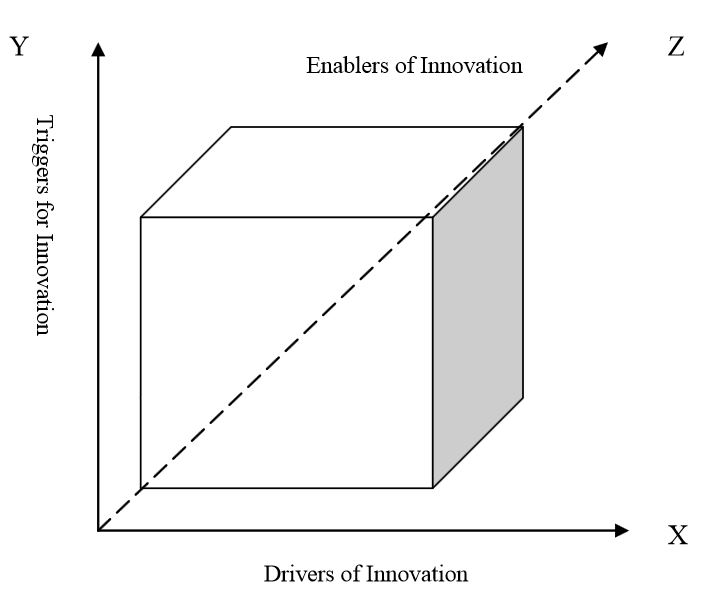
Figure – 3 – Source – A.D.Narasimhalu (Singapore Management University, 2010)