We are using ceilometer to collect data energy from our servers. As noted previously we were having some performance issues and we needed to investigate further. In this blog post we will cover our approach to performing profiling on ceilometer API to determine where the problems arose.
Of course, the first step was to take a look at the log files (in /var/log/ceilometer-all.log); as there was nothing unusual in there, we decided to perform profiling of the code.
The ceilometer API is served via a simple WSGI server which uses the pecan framework to support routing of requests, simple authentication and configuration of the API. In order to profile the code, it is necessary to intercept the request handling in the WSGI server and add the profilng code there. To do this, we needed to create a new WSGIRequestHandler which activated profiling (using cProfile), passed the request to the default handler before deactivating handling and providing a return value. The output of the profiling is then stored in /tmp/profile. The code below shows how this was done.
/ceilometer/api/app.py:153
class TestHandler(simple_server.WSGIRequestHandler):
    def handle(self, *args, **kwargs):
        LOG.info('Handling basic request.')
        import cProfile
        profile = cProfile.Profile()
        profile.enable()
        temp = simple_server.WSGIRequestHandler.handle(self, *args, **kwargs)
        profile.disable()
        profile.dump_stats('/tmp/profile')
        return temp

def build_server():
    # Build the WSGI app
    root = VersionSelectorApplication()
    # Create the WSGI server and start it
    host, port = cfg.CONF.api.host, cfg.CONF.api.port
    server_cls = get_server_cls(host)
    srv = simple_server.make_server(host, port, root, server_cls, TestHandler)
Profiling was then active on each call to the ceilometer API. We then made a call to the API (ceilometer samples-list in this case) and the profiling data for the call is generated. We used Fabric to access the server via ssh and download the file to local machine. Then cprofilev is used to display the results of the profiling such that they are visible within a browser. The results are below.
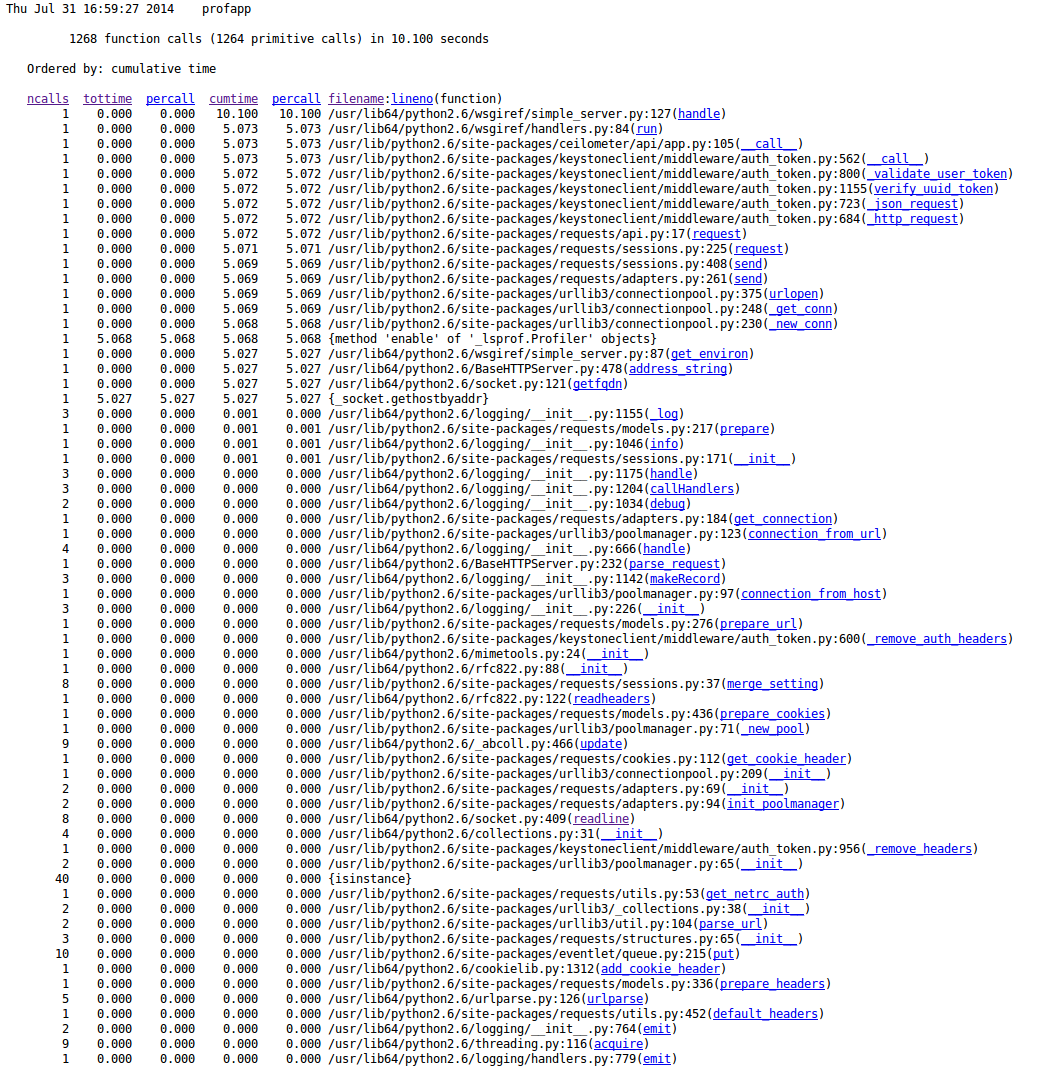
In our specific case, we found a problem with our DNS settings which manifested in the _socket.gethostbyaddr() call – while this may be a little bit of a heavy approach to determining this, it was useful for us to be able to instrument ceilometer in case of any performance issues.