I assume you are confident using a shell, installing software and generally building software from source.
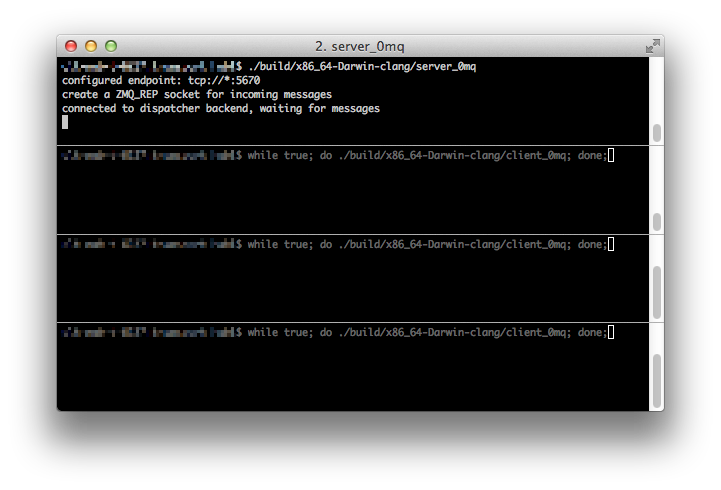
While writing C code for a networking library I did some simple stability tests by setting up a simple server replying to a client query, no magic at all just hard coded strings. Obviously in such situations you will a have an eye on a process monitor like htop.
So I just ran the server and three clients in a endless loop:
while true; do binary; done
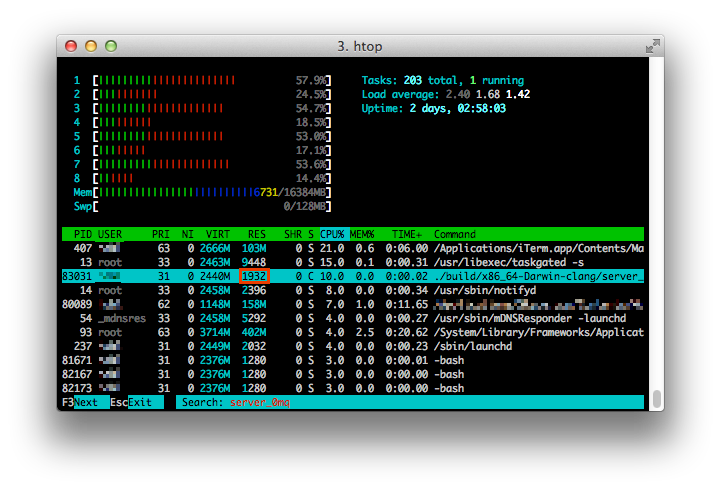
A quick look in htop revealed that my code leaked memory, not much per loop (around 20-30 Bytes) but still: In code which shall be once shipped in productive environment this is fatal. You can easily recognize such problems by looking at the RES column, if this value increases without clear reason you have somewhere a memory leak.
For this type of problem you take valgrind. But since valgrind warns that their support on Mac OS X being broken I had to switch over to Linux. For such cases I recommend the Fedora Security Spin which comes with a huge load of tools aimed at security, auditing, research, rescue and obviously developper.
But before analyzing you need to tweak a few things: If you compile third party libraries by yourself consider passing the compiler flags -g -O0 to make sure the compiler produces debug symbols and doesn’t optimize too much making it harder to find the leaks. So make sure you invoke the configure script as follows:
make clean
./configure CFLAGS="$CFLAGS -g -O0" CXXFLAGS="$CXXFLAGS -g -O0"
make all
sudo make install
And evidently your code has also to be built with debug symbols and optimizations turned off, I’ll show you how this looks like in my Makefile:
CC = clang
BASICOPTS = -g -O0
CFLAGS = $(BASICOPTS) -pedantic -Wall -std=c11
Using -pedantic -Wall allows the compiler to warn you about every little mistake you write, always a good idea. Personally I recommend clang since it produces better error output.
Then you are ready to go hunting memory leaks! Start valgrind as following:
valgrind --tool=memcheck --leak-check=full
    --show-possibly-lost=no your-binary
Then after one I killed my server binary with ctrl-c and got a nice output:
==3955==
==3955== HEAP SUMMARY:
==3955==     in use at exit: 58,693 bytes in 76 blocks
==3955==   total heap usage: 162 allocs, 86 frees, 104,671 bytes all
ocated
==3955==
==3955== 25 bytes in 1 blocks are definitely lost in loss record 13
of 71
==3955==    at 0x4A06409: malloc (in /usr/lib64/valgrind/vgpreload_m
emcheck-amd64-linux.so)
==3955==    by 0x4EB2717: zframe_strdup (zframe.c:246)
==3955==    by 0x4014B9: _recv_message (kt_server.c:119)
            [snip]
==3955== 36 bytes in 1 blocks are definitely lost in loss record 15
of 71
==3955==    at 0x4A08121: calloc (in /usr/lib64/valgrind/vgpreload_me
mcheck-amd64-linux.so)
==3955==    by 0x4EB2117: safe_malloc (czmq_prelude.h:445)
==3955==    by 0x4EB21BB: zframe_new (zframe.c:59)
==3955==    by 0x4EB231A: zframe_recv (zframe.c:115)
==3955==    by 0x4EB780D: zmsg_recv (zmsg.c:101)
==3955==    by 0x40144E: _recv_message (kt_server.c:115)
==3955==
==3955== LEAK SUMMARY:
==3955==    definitely lost: 61 bytes in 2 blocks
==3955==    indirectly lost: 0 bytes in 0 blocks
==3955==      possibly lost: 1,256 bytes in 12 blocks
==3955==    still reachable: 57,376 bytes in 62 blocks
==3955==         suppressed: 0 bytes in 0 blocks
==3955== Reachable blocks (those to which a pointer was found) are n
ot shown.
==3955== To see them, rerun with: --leak-check=full --show-reachable
=yes
==3955==
==3955== For counts of detected and suppressed errors, rerun with: -v
==3955== ERROR SUMMARY: 14 errors from 14 contexts (suppressed: 2 fro
m 2)
Killed
Which shows I’m leaking memory in my code in two places. Reading the stack-trace when we go up a few stack frames while skipping the internal calls of zeromq we see two matching lines: kt_server.c:115 and kt_server.c:119. Let’s first tackle the bigger leak at kt_server.c:119:
msg->msgData = zframe_strdup(zmsg_pop(m));
That for I have to look closely what my code does and consult the API reference of czmq:
//  Remove first frame from message, if any. Returns frame, or NULL.
// Caller now owns frame and must destroy it when finished with it.
CZMQ_EXPORT zframe_t *
    zmsg_pop (zmsg_t *self);
And that’s what I forgot: “Caller now owns frame and must destroy it when finished with it.” I simply popped memory but didn’t care about freeing it. After changing the line to
msg->msgData = zmsg_popstr (m);
I was left with the first memory leak at kt_server.c:115. My code calls _recv_message() and receives a struct with a char* to the received message. Then I simply added a new response message and called _send_message():
msg = _recv_message ();

char *response = malloc(sizeof(char) * 128);
memcpy (response, "Hello World", 12);
printf ("Request: %sn", msg->msgData);
msg->msgData = response;

_send_message (msg);
The problem here is also pretty obvious: char *msgData formerly pointing to the received message is newly pointing to my freshly malloc-ed memory without freeing the old memory. So adding free (msg->msgData); solved this leak. I’ll leave figuring out where this statement goes in as an exercise to the reader.
Also an easy mistake is to forget freeing memory in _send_message() since zframe_send() requires you to destroy the passed zframe_t.
int _send_message (message_t msg)
{
    zframe_t *frame_reply = zframe_new (msg->msgData,
        strlen(msg->msgData));
    zframe_send (&frame_reply, sock, ZFRAME_REUSE);
    zframe_destroy (&frame_reply);
    free (msg);
    return 0;
}
Did you see what’s wrong here? Let’s have a look at the struct message_t which I simplified down to the relevant:
typedef struct message_t {
    char *msgData;
} message_t;
Correct: I call free (msg); which indicates that msg is a struct on the heap (allocated by malloc()) but the member char *msgData is simply a pointer on an other memory which waits to be free’d too. Let’s assume I was tired and put it after the first free:
free (msg);
free (msg->msgData);
What would happen? Well yes, your code would probably just segfault. But why? msg points after the free() to a probably otherwise used memory or is even NULL. The manpage of free(3) clearly says that ” … the behavior is undefined if the memory area referred to by ptr has already been deallocated … ” so eventually I cannot access msgData anymore. Correct would be to deallocate the memory from inside out:
free (msg->msgData);
free (msg);
A final run of valgrind shows now: My code is memory leak free!
