Following our previous blog post, we are still looking at tools for collecting metrics from an Openstack deployment in order to understand its resource utilization. Although Monasca has a comprehensive set of metrics and alarm definitions, the complex installation process combined with a lack of documentation makes it a frustrating experience to get it up and running. Further, although it is complex, with many moving parts, it was difficult to configure it to obtain the analysis we wanted from the raw data, viz how many of our servers are overloaded over different timescales in different respects (cpu, memory, disk io, network io). For these reasons we decided to try Prometheus with Grafana which turned out to be much easier to install and configure (taking less than an hour to set up!). This blog post covers the installation process and configuration of Prometheus and Grafana in a Docker container and how to install and configure Canonical’s Prometheus Openstack exporter to collect a small set of metrics related to an Openstack deployment.
Note that minor changes to this HOWTO are required to install theses services in a VM or in a host machine when using containers is not an option. As preparation, take note of your Openstack deployment’s locations for Keystone and the Docker host. Remember that all downloads should be verified by signature comparison for production use.
Installing and configuring Prometheus
First of all pull the Ubuntu image into you docker machine. Let’s call it docker-host.
Note that in this blog post we describe Prometheus installation process step-by-step – we chose to install it from scratch to get a better understanding of the system, but using the pre-canned Docker Hub image is also possible.
docker pull ubuntu:14.04
Then create the docker container opening the port 9090 which will be used to get/push metrics into Prometheus.
docker run -it -p 9090:9090 --name prometheus ubuntu:14.04
Inside the container download the latest version of Prometheus and uncompress it (version 1.3.1 is used in this HOWTO; the download size is ca. 16 MB).
wget https://github.com/prometheus/prometheus/releases/download/v1.3.1/prometheus-1.3.1.linux-amd64.tar.gz
tar xvf prometheus-1.3.1.linux-amd64.tar.gz
cd prometheus-1.3.1.linux-amd64
Configure prometheus.yml adding the targets from which prometheus should scrape metrics. See the example below for the Openstack exporter (assuming it is installed in the same docker-host):
scrape_configs:
  - job_name: 'openstack-deployment-1'
    scrape_interval: 5m
    Static_configs:
      - targets: ['docker-host:9183']
Start the Prometheus service:
./prometheus -config.file=prometheus.yml
Similarly, install and configure the Prometheus Openstack exporter in another container. Note that this container needs to be set up manually as there are configuration files to be changed and Openstack libraries to be installed.
docker run -it -p 9183:9183 --name prometheus-openstack-exporter ubuntu:14.04
sudo apt-get install python-neutronclient python-novaclient python-keystoneclient python-netaddr unzip wget python-pip python-dev python-yaml
pip install prometheus_client
wget https://github.com/CanonicalLtd/prometheus-openstack-exporter/archive/master.zip
unzip master.zip
cd prometheus-openstack-exporter-master/
Next, configure prometheus-openstack-exporter.yaml create the /var/cache/prometheus-openstack-exporter/ directory and the novarc file containing credentials for Nova user.
mkdir /var/cache/prometheus-openstack-exporter/
echo  export OS_USERNAME=nova-username \
      export OS_PASSWORD=nova-password \
      export OS_AUTH_URL=http://keystone-url:5000/v2.0 \
      export OS_REGION_NAME=RegionOne \
      export OS_TENANT_NAME=services > novarc
source novarc
./prometheus-openstack-exporter prometheus-openstack-exporter.yaml
Then you’ve got a fully functional Prometheus system with some Openstack metrics on it! Visit http://docker-host:9090 to graph and see which metrics are available.
Here is the list of the 18 metrics currently collected by Prometheus Openstack exporter:
| neutron_public_ip_usage | hypervisor_memory_mbs_total |
| neutron_net_size | hypervisor_running_vms |
| hypervisor_memory_mbs_used | hypervisor_disk_gbs_total |
| hypervisor_vcpus_total | hypervisor_disk_gbs_used |
| openstack_allocation_ratio | hypervisor_vcpus_used |
| nova_instances | nova_resources_ram_mbs |
| nova_resources_disk_gbs | swift_replication_duration_seconds |
| openstack_exporter_cache_age_seconds | swift_disk_usage_bytes |
| swift_replication_stats | swift_quarantined_objects |
Alternatively you could use Prometheus’s Node exporter for more detailed metrics on node usage – this needs to be installed in the controller/compute nodes and the prometheus.yml configuration file also needs to be changed. A docker container is also available at Docker Hub.
Although Prometheus provides some rudimentary graph support, combining it with a more powerful graphing solution makes it much easier to see what’s going on in your system. For this reason, we set up Grafana.
Installing Grafana
The latest version of Grafana (currently 4.0.0-beta2) had a lot of improvements in its user interface, it also supports now alerting and notifications for every panel available – refer to the documentation for more information. Its integration with Prometheus is very straightforward, as described below.
First of all, pull the grafana image into your docker-host and create the docker container opening the port 3000 used to access it.
docker pull grafana/grafana
docker run -d -p 3000:3000 grafana/grafana:4.0.0-beta2
Visit http://docker-host:3000 and use the credentials admin/admin to log into the dashboard. In the Data Sources tab, add a new corresponding data source.

Create a new dashboard and add panels containing graphs using the Prometheus datasource.
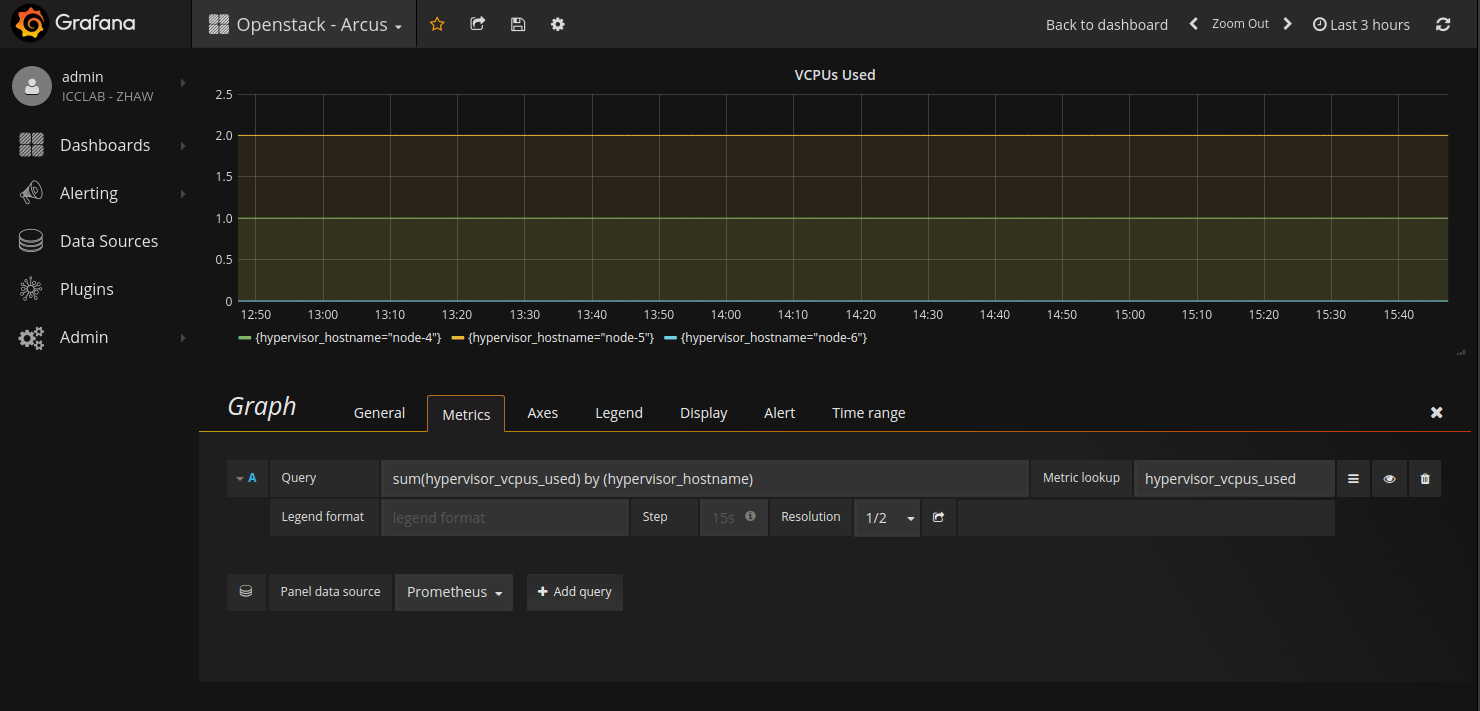
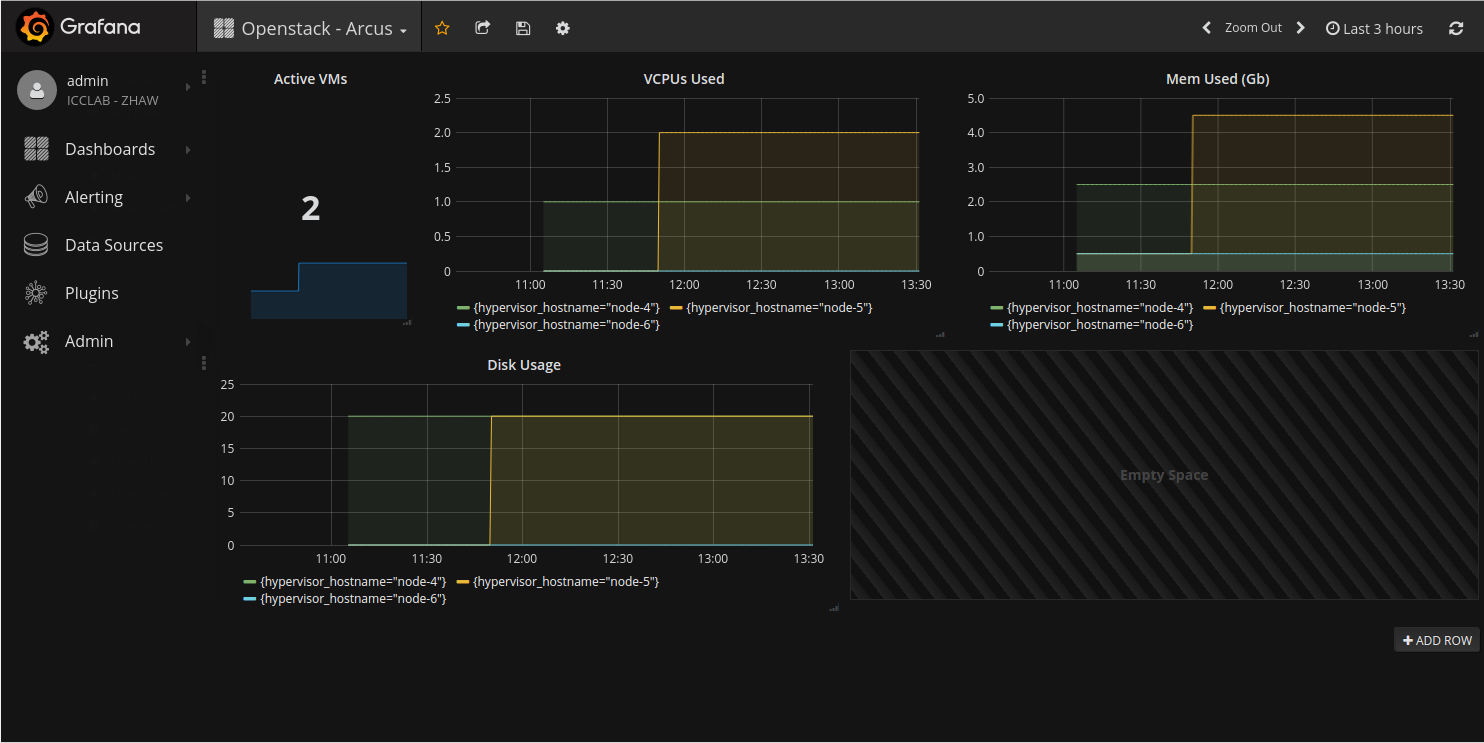
Play around with metrics available and create your own dashboard! See a simple example below.
Conclusion
Although not many metrics are available yet to monitor an Openstack deployment the combination of Prometheus and Grafana is quite powerful for visualising data; also it was much easier to set up in comparison with Monasca. Further, from a cursory glance, Prometheus seems to be more flexible than Monasca and for these reasons it appears more promising. That said, we are still looking into Prometheus and how it can be used to properly understand resource consumption in an Openstack context, but that will come in another blog post!
Does is it work with Keystone v3 ?
Thank!
Currently it only supports Keystone V2.0 but you could also change the code and add support for V3.
The exporter is quite new and still at its early stage of development – hopefully there will be improvements in the future adding support for more services.
i have a issue: prometheus is running with version 1.2.x and when i start prometheus-openstack-exporter:
– – [06/Dec/2016 03:41:52] “GET /metrics HTTP/1.1” 500 –
I upgrade prometheus to version 1.4.1, still get 500 code.
I just tested with Prometheus 1.4.1 and still working for us.
For debugging I recommend you to check if it is possible get the metrics directly instead of depending on prometheus-server. It seems it is a problem in the client side instead of prometheus-server.
For that you could visit http://docker-host:9183/metrics (where docker host is the IP where the container is running on) or send curl requests to the same address.
Yup, i visit http://docker-host:9183/metrics, it show:
Traceback (most recent call last):
File “./prometheus-openstack-exporter”, line 365, in do_GET
swift.get_stats() + \
File “./prometheus-openstack-exporter”, line 290, in get_stats
self.gen_instance_stats()
File “./prometheus-openstack-exporter”, line 270, in gen_instance_stats
flavor = self.flavor_map[i[‘flavor’][‘id’]]
KeyError: u’3′
I don’t need to get metrics of swift, so any solution to fix it?
May be, i commend this line in code?
Yes, you could either comment out or remove swift configuration in prometheus-openstack-exporter.yaml file.
i commend swift line in prometheus-openstack-exporter.yaml, but still get like this:
Traceback (most recent call last):
File “./prometheus-openstack-exporter”, line 365, in do_GET
swift.get_stats() + \
File “./prometheus-openstack-exporter”, line 290, in get_stats
self.gen_instance_stats()
File “./prometheus-openstack-exporter”, line 270, in gen_instance_stats
flavor = self.flavor_map[i[‘flavor’][‘id’]]
KeyError: u’3′
Hi Thinh Le,
Unfortunately I cannot help any further – that seems to be an error mapping flavor_id from your Openstack deployment to the exporter.
The easiest approach to solve this problem is to create an issue in the Github repository of the exporter. The developers there might be able to tell you more about the error you are facing at the moment.
Hi Bruno Grazioli,
Thank you so much.
Hello Bruno:
I appreciate your Job, i make this tutorial step by step, however i’m get an error in docker-host:9183/ such as:
IOError: [Errno 2] No such file or directory: ‘var/cache/prometheus-openstack-exporter/’
i think this issue is relating to:
File “/usr/lib/python2.7/dist-packages/keystoneclient/session.py”, line 251, in request
raise exceptions.from_response(resp, method, url)
NotFound: The resource could not be found. (HTTP 404)
but, the nova client works whitout any problem…
Thanks Bruno
Is Keystone v3 now supported?
Best regards
Thomas
Looks like they are still working on this. (https://github.com/CanonicalLtd/prometheus-openstack-exporter/issues/14)
is there any follow up article on prometheus as is mentioned in the blog ??
Hi
I am using insecure connection for all api in the openstack environment
so after source novarc, in order to return output I have to run
# nova –insecure list
So in Prometheus openstack exporter script , I get below error:
/usr/local/lib/python2.7/dist-packages/urllib3/util/ssl_.py:137: InsecurePlatformWarning: A true SSLContext object is not available. This prevents urllib3 from configuring SSL appropriately and may cause certain SSL connections to fail. You can upgrade to a newer version of Python to solve this. For more information, see https://urllib3.readthedocs.io/en/latest/advanced-usage.html#ssl-warnings
InsecurePlatformWarning
Traceback (most recent call last):
File “./prometheus-openstack-exporter”, line 79, in run
keystone = keystone_client.Client(**creds)
File “/usr/local/lib/python2.7/dist-packages/keystoneclient/v2_0/client.py”, line 176, in __init__
self.authenticate()
File “/usr/local/lib/python2.7/dist-packages/wrapt/wrappers.py”, line 562, in __call__
args, kwargs)
File “/usr/local/lib/python2.7/dist-packages/positional/__init__.py”, line 108, in inner
return wrapped(*args, **kwargs)
File “/usr/local/lib/python2.7/dist-packages/keystoneclient/httpclient.py”, line 581, in authenticate
resp = self.get_raw_token_from_identity_service(**kwargs)
File “/usr/local/lib/python2.7/dist-packages/keystoneclient/v2_0/client.py”, line 220, in get_raw_token_from_identity_service
_(“Authorization Failed: %s”) % e)
AuthorizationFailure: Authorization Failed: SSL exception connecting to https://10.144.106.137:5000/v2.0/tokens: HTTPSConnectionPool(host=’10.144.106.137′, port=5000): Max retries exceeded with url: /v2.0/tokens (Caused by SSLError(SSLError(1, ‘_ssl.c:510: error:14090086:SSL routines:SSL3_GET_SERVER_CERTIFICATE:certificate verify failed’),))
So is there any way in yaml configuration , so I can have prometheus connections via api all to be insecure connections. ?
I’m not really sure if the exporter supports TLS certificates as we did not use it at the time we were experimenting with the exporter.
I would recommend to file a bug in their github repository at – https://github.com/CanonicalLtd/prometheus-openstack-exporter – with the issue mentioned above. I’m sure the maintainers will be able to help you out.
Hi,
thanks for this tutorial it is really useful.
Just one comment:
I needed to install also python-cinderclient to make it starting.
Unfortunately I’m having such problem:
[user@node ~]$ curl localhost:9183/metrics
Traceback (most recent call last):
File “./prometheus-openstack-exporter”, line 565, in do_GET
neutron = Neutron()
File “./prometheus-openstack-exporter”, line 200, in __init__
with open(config[‘cache_file’], ‘rb’) as f:
IOError: [Errno 2] No such file or directory: ‘/var/cache/prometheus-openstack-exporter/mycloud’
when callijg metrics. The directory is there and has the right permissions.
Has anyone experienced the same problem?
Thanks so much in advance.
Cheers,
Luca
I haven’t seen this issue before as at the time we wrote there was no support for cinder iirc. The issue you reported seems to me a configuration problem, have a look here – https://github.com/CanonicalLtd/prometheus-openstack-exporter/blob/master/prometheus-openstack-exporter.yaml. Maybe cloud and cache_file variables need to be replaced.
I seem to have both up containers setup individually and reporting , but I cannot seem to pull the 18 metrics from prometheus when in graph localhost:9090