NOTE TO THE READER – 16 Jun 2014: after this post was published, some very insightful comments have been issued that made me consider the necessity of adding this note to warn the readers and remark what has been compared in this study. Ceph and Swift have been deployed and compared as object storage systems and not necessarily as ReSTful services (typically accessed over HTTP). Consequently, we have used librados to access Ceph and the ReST HTTP APIs to access Swift. This is a difference that marks a distinction between the two systems after they have been deployed on a private storage cluster. However, accessing the two systems with this two different interfaces entails a bigger overhead (thus less performance) for Swift than for Ceph. For this study, focused on small clusters, this is part of the differences between the two services under test. On production deployments however, it may make more sense to use the well established Swift HTTP APIs also for Ceph (available with the additional radosgw component) and the results here shown should not (read: must not) be applied for that case.
Introduction
Swift and Ceph are two popular cloud storage systems that provide object-based access to data (Ceph also supports file and block storage).
The Swift project ships an open source codebase entirely written in Python and its development is currently led by SwiftStack. Feature-wise, Swift is an object storage service that supports ReSTful HTTP APIs, data replication across different logical zones, arbitrarily large objects, scaling-out without downtime, etc.
Ceph is mostly written in C++, but it also includes some parts in Perl, C and Python. The company leading its development (InkTank) was acquired by RedHat in April 2014. Ceph presents a more rich set of features, most notably by supporting block- and file-storage besides object-storage. The supported file systems for object storage devices (OSDs) are xfs, btrfs and ext4, with xfs being recommended for production deployments. Data placement in Ceph is determined through the CRUSH algorithm, which computes storage locations for target data and enables clients to communicate directly with OSDs. Ceph allows for the fine tuning of many configuration parameters, including the definition of a CRUSH map (a logical description of the physical infrastructure of the data center), the specification of replication requirements on a per-pool level (pools are containers of objects), the definition of rulesets for data placement (e.g., to avoid placement of replicas within the same host), etc.
Objectives of this study
The objective of this experiment is to compare two different storage systems for the cloud (both Swift and Ceph can be used with OpenStack) with an object-based interface, with the intention of evaluating the performance of Ceph with respect to a system – Swift, that is considered to be very mature and counts already many production deployments. Important institutions or companies use Swift for their storage or as a basis on which their storage services are built (wikimedia, Disney, Spilgames, HP …).
The storage cluster used for the comparison is a small one that could be seen in private deployments for limited storage needs or on experimental environments. This study aims at evaluating the differences that may arise when using the two services on such a scaled down cluster and which limiting factors should be taken into account when using distributed storage on small deployments.
Hardware configuration
Network infrastructure
A storage cluster has been configured using three servers of the ICCLab data center and its networking infrastructure.
All the nodes have the same hardware configuration and are connected over a dedicated storage VLAN through Gigabit Ethernet links (1000Base-T cabling).
   Node1 (.2)             Node2 (.3)              Node3 (.4)
     |                       |                       |
     |                       |                       |
     |                       |                       |
<=====================10.0.5.x/24=========================>
Servers
- Lynx CALLEO Application Server 1240
- 2x Intel® Xeon® E5620 (4 core)
- 8x 8 GB DDR3 SDRAM, 1333 MHz, registered, ECC
- 4x 1 TB Enterprise SATA-3 Hard Disk, 7200 RPM, 6 Gb/s (Seagate® ST1000NM0011)
- 2x Gigabit Ethernet network interfaces
Performance of local disks
The performance of the local disks have been measured with hdparm (read) and dd (write):
Read: ca. 140 MB/s
$ sudo hdparm -t --direct /dev/sdb1

/dev/sdb1:
 Timing O_DIRECT disk reads: 430 MB in  3.00 seconds = 143.17 MB/sec
Write: ca. 120 MB/s (with 1G Bytes block)
$ dd if=/dev/zero of=anof bs=1G count=1 oflag=direct
1+0 records in
1+0 records out
1073741824 bytes (1.1 GB) copied, 8.75321 s, 123 MB/s
All the other devices in the cluster have produced similar results (all the hard drives are the same model).
Network performance
To measure the bandwidth between a Ceph storage node and the node running the benchmarks we have used iperf:
$ iperf -c ceph-osd0
------------------------------------------------------------
Client connecting to ceph-osd0, TCP port 5001
TCP window size: 85.0 KByte (default)
------------------------------------------------------------
[  3] local 10.0.5.2 port 41012 connected with 10.0.5.3 port 5001
[ ID] Interval       Transfer     Bandwidth
[  3]  0.0-10.0 sec  1.10 GBytes   942 Mbits/sec
For quick reference: 942 Mbits/sec = 117.75 MB/s
Software configuration
- Operating system: Ubuntu 14.04 Server Edition with Kernel 3.13.0-24-generic
- ceph version 0.79 (4c2d73a5095f527c3a2168deb5fa54b3c8991a6e)
- swift 1.13.1
To avoid biases in the measurement of the performance of the two systems, Ceph was completely shutdown when Swift was running and vice-versa.
Cloud storage configuration
For the production of meaningful statistics, equivalent configurations (where applicable) have been used for both Ceph and Swift.
In both benchmarks, Node1 has been used as a “control” node (monitor node in Ceph and Proxy node in Swift) and it has not been used for data storage purposes.
Node2 and Node3, each one containing 4 Hard Drives, have been used as the storage devices for objects and their replicas. For consistency of performance measurements, both systems have been configured with a replication level of 3 (three replicas for each object).
Ceph
With respect to the reference physical infrastructure, a Ceph cluster has been deployed using the following logical mappings:
-
Node1 ==> Ceph MON0 (monitor node)
-
Node2 ==> Ceph OSD0 (storage node 0)
-
Node3 ==> Ceph OSD1 (storage node 1)
No Metadata Server nodes (MDS) have been used as we have configured Ceph for object-storage only (MDS is required for the Ceph Filesystem).
For each of the two storage nodes, two 1TB HDDs have been used as OSDs and a dedicated 1TB HDD has been used for journaling (the remaining HDD was reserved for the OS and software installation). All OSDs have been formatted with an xfs filesystem and gpt label.
The following diagram depicts the storage configuration used for Ceph, with a total of one monitor node and four OSDs:
[Node1 - MON]         [Node2 - OSD]           [Node2 - OSD]
 =========================================================
[HDD1: OS]            [HDD1: OS]              [HDD1: OS]
[HDD2: not used]      [HDD2: osd.0 - xfs]     [HDD2: osd.2 - xfs]
[HDD3: not used]      [HDD3: osd.1 - xfs]     [HDD3: osd.3 - xfs]
[HDD4: not used]      [HDD4: journal]         [HDD4: journal]
Each data pool was created with a replica size of 3 and min_size of 2 (each object is replicated three times, but I/O operations on a certain object are allowed after only two replicas are in place), using custom rulesets that allow the replication of objects within the same host (the default would be to replicate objects on separate hosts).
The number of placement groups (PGs) for each pool has been determined with the approximate heuristic formula reported in the official documentation:
    (OSDs * 100)
x = ------------;    PGs = x rounded up to the nearest power of two
      Replicas
In this case, the result of 133 has been approximated to get 128 PGs for this deployment.
Swift
The Swift cluster has been configured with one proxy node and two storage nodes.
To maintain consistency with the Ceph configuration, only two disks of each storage node have been used for data and formatted with an xfs filesystem. Similarly, to apply the same replication policy as in Ceph, each disk has been assigned to a different zone and the replicas parameter has been set to 3.
The following diagram depicts the storage configuration used for Swift, with a total of one proxy node and four storage devices:
[Node1 - Proxy]       [Node2 - Storage]       [Node2 - Storage]
 =============================================================
[HDD1: OS]            [HDD1: OS]              [HDD1: OS]
[HDD2: not used]      [HDD2: dev1 - xfs]      [HDD2: dev3 - xfs]
[HDD3: not used]      [HDD3: dev2 - xfs]      [HDD3: dev4 - xfs]
[HDD4: not used]      [HDD4: not used]        [HDD4: not used]
All devices have the same weight and belong to the same region.
Given the amount of available disks, and a roughly estimated number of 100 partitions per disk, the ring partition power has been set to 9, accounting for a total of 512 partitions.
The number of workers for the different Swift server components has been configured as follows (configuration guidelines):
- Proxy server: 8
- Account: 4
- Container server: 4
- Object server: 4 (with 4 threads per disk)
The auditor, replicator, reaper and updater settings have been left to their default values.
Benchmark tool: COSBench
COSBench is a benchmarking tool for cloud object storage developed by Intel and released to the public on GitHub. Among the other supported object storage systems, COSBench supports both Swift and Ceph, the latter using librados for Java.
COSBench allows the definition of workloads with a convenient XML syntax, it ships a web interface to submit new workloads and to monitor the process of ongoing ones and it automatically stores workloads statistics as CSV files.
The COSBench version used to produce these results was 0.4.0.b2.
Workloads
One set of workloads has been defined and used for both Ceph and Swift. Some adaptations were required for the different authentication mechanisms and for letting COSBench use pre-provisioned pools (the equivalent of Swift containers) for Ceph. This change was necessary to avoid that COSBench created new pools which would have used undesired default settings (replication levels and crush rulesets not matching the needed ones and inadequate number of placement groups).
For this benchmarks, 12 distinct workloads have been used. Each workload has been populated with 18 workstages (excluding the special stages to prepare and cleanup each workload).
Each workload has been defined to use a definite number of containers (pools in Ceph) and objects size. For example, in workload 1, every workstage was running with 1 container and objects of 4 kB.
Different workstages applied different distributions of read/write/delete operations and different number of workers for each read/write/delete phase.
Each workstage had a rampup time of 2 minutes and a total running time of 10 minutes (for a total of 12 minutes per stage). The read/write/delete operations for each stage were uniformly distributed across the available containers for that workload and a fixed number of 1000 objects per container.
Different configuration for each parameter has been used as shown in the following table:
|
Containers |
Objects size |
R/W/D Distribution (%) |
Workers |
|
1 |
4 kB |
80/15/5 |
1 |
|
20 |
128 kB |
100/0/0 |
16 |
|
512 kB |
0/100/0 |
64 |
|
|
1024 kB |
128 |
||
|
5 MB |
256 |
||
|
10 MB |
512 |
The total number of executed workstages is given by all the possible combinations of the values of each column with all the others, resulting in 216 stages, for a total running time of 43.2 hours for each set of workloads for each storage system.
In particular, the number of containers and the objects size were defined on a per-workload basis, while workstages within the same workload used different read/write/delete distributions and different number of parallel workers.
Naming conventions
Workload names are of the form <x>cont_<y><s>b where
-
<x> is the number of containers
-
<y> is the size of the containers expressed either in kB or MB
-
<s> is the unit for the containers size. For this session, <s> can either be ‘k’ (for kilo) or ‘m’ (for mega)
Sizes are always expressed in bytes, even when a lowercase ‘b’ is used such as in ‘kb’ or ‘mb’ (kb = 1000 bytes, mb = 1000 * 1000 bytes).
Metrics
COSBench collects statistics about the system under test with a configurable period that for these benchmarks was set to the default value of 5 seconds.
Statistics are then written to CSV files and also viewable on the web interface (for running workloads, statistics are also displayed at real-time).
COSBench produces the following statistics for each workload:
- One file for each workstage with the sampled values for each metric, for each sampling period
- One file with the average values for each metric for each workstage (1 value per metric per workstage)
- One file with the response-time analysis for each workstage (number of samples within a certain response-time window for each workstage)
The metrics for which COSBench collects statistics are: Op-Count (number of operations), Byte-Count (number of bytes), Response-Time (average response time for each successful request), Processing-Time (average processing time for each successful request), Throughput (operations per seconds), Bandwidth (bytes per seconds), Success-Ratio (ratio of successful operations).
Graphs generation
Graphs have been generated from the CSV data output by COSBench using a dedicated tool that has been developed for this purpose: cosbench-plot.
The project is available on GitHub: https://github.com/icclab/cosbench-plot
Performance results
Read operations
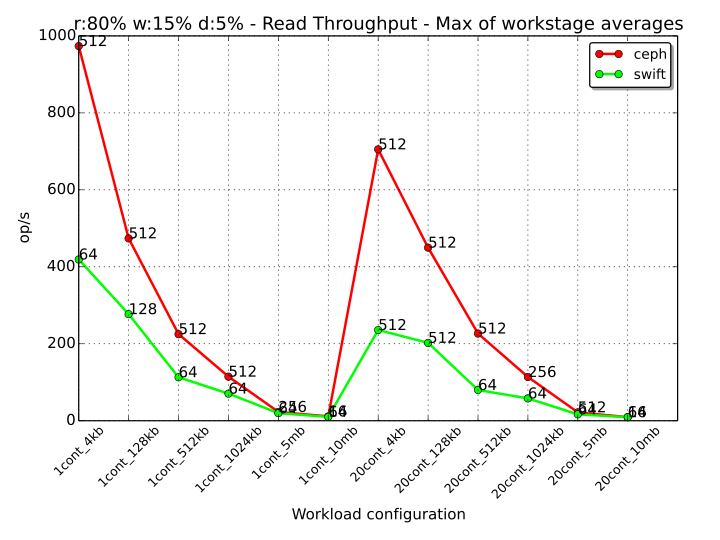
The following graph shows the read throughput for 100% read workstages for every workload for both Ceph and Swift. The values displayed in the chart are the maximums of the averages across the considered workstages for any particular workload. The text annotation next to each value denotes the workstage in which the average for that metric had the highest value. In this case, the annotation represents the number of threads for that workstage. For example, we can observe that for the “1cont_128kb” workload (1 container, 128 kB objects), the Ceph workstage with 100% read operations that scored the highest average Throughput (across the workload), was the one with 512 threads. Swift achieved its best result in the same scenario with the workstage with 64 threads.
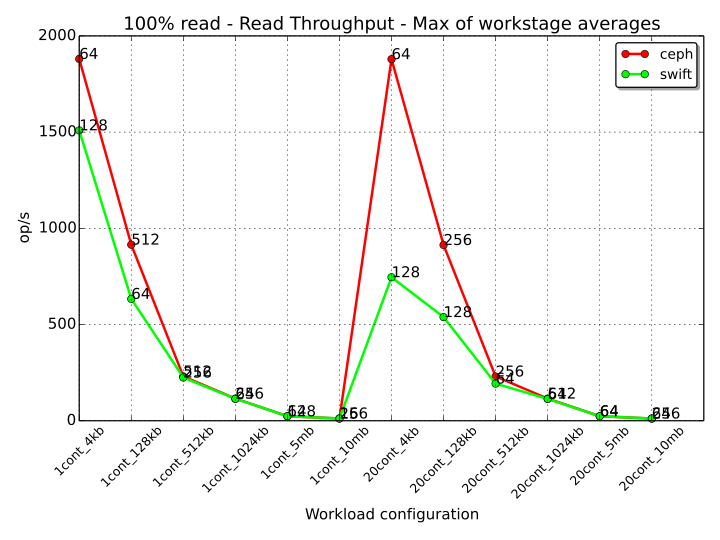
From this graph we can observe that Ceph manages a higher number of read operations than Swift when the object size is small, with an even more prominent difference when the available containers are 20 instead of 1 (20000 and 1000 totally available objects respectively). When the object size grows to 1024 kB and above, the amount of read operations that the two systems can perform is approximately the same, but each system reaches its highest performance with a different number of threads. The general trend that can be observed is that Ceph can reach a better performance with more parallel workers than Swift, denoting a better behavior to handle an increasing number of parallel requests.
The following graph provides an indication of the difference between the throughput performance of both storage systems on the 100% read workstages of the “1cont_4kb” workload:

On Ceph, both workstages with 64 and 16 workers score well, while 512 workers obtain a slightly more degraded performance. This is due to the fact that threads are accessing (with a random uniform distribution) a single pool of 1000 objects of very small size, thus every read operation requires a very short processing time, compared to which, the overhead for the synchronization of the threads results to be not negligible. An interesting statistic comes from the workstage with a single worker, in which Ceph performs sensibly better than Swift. This is probably a consequence of the Ceph CRUSH algorithm for objects lookup with librados access being more efficient (in this case) than the HTTP-based access to the ring mappings in Swift. Again, this difference can be appreciated because the processing time for reading small 4 kB objects is very small, emphasizing the impact of the lookup operation on the overall performance.
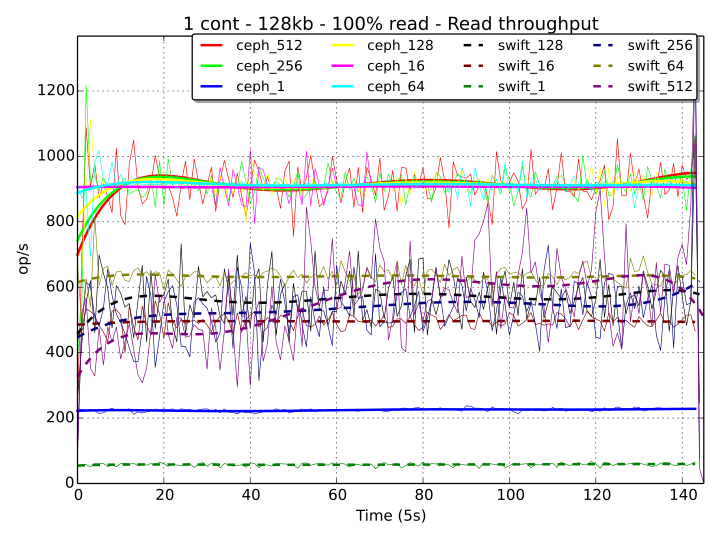
In case of slightly bigger objects (128 kB), we can observe that the throughput performance of Ceph is almost equivalent for any number of workers greater than 1, while Swift has a performance increase when going from 16 to 64 threads, but experiences a degradation when the number of threads is bigger than 128.
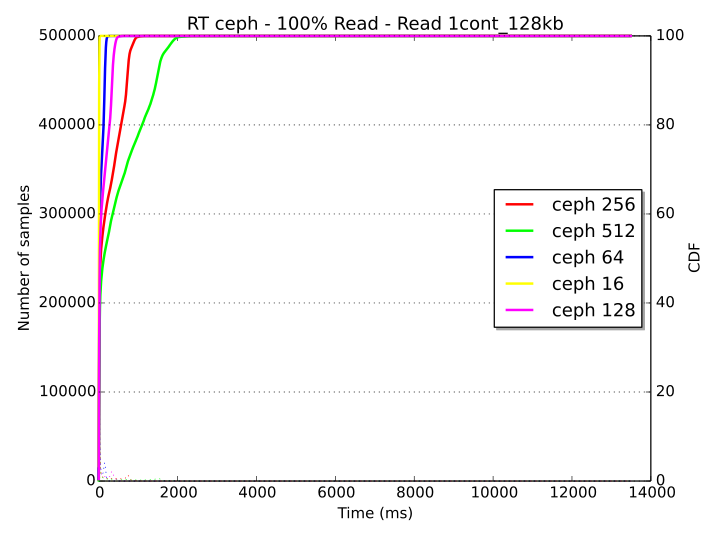
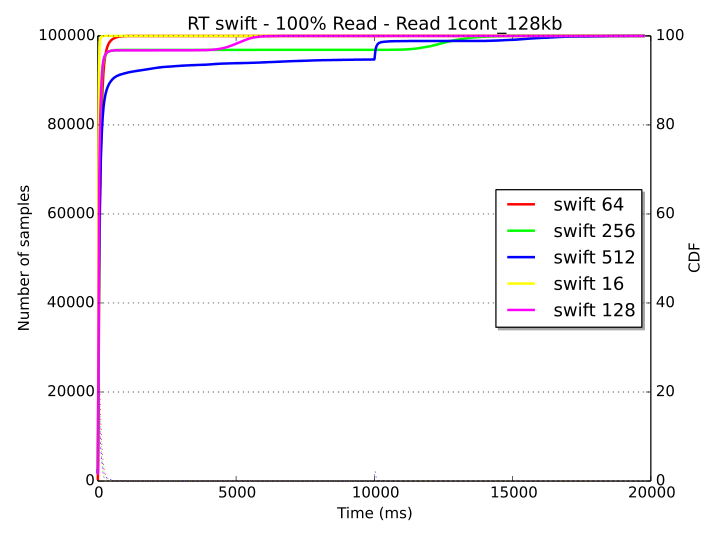
The following response time diagrams provide a more clear picture of the saturation level of the system for the “1cont_128kb” workload. With Ceph (first diagram), only a small set of samples experiences a delay of about 2 seconds and almost all samples are below this threshold. With Swift (second diagram), the response time is very low in all cases until about the 95th percentile. After this point of the Cumulative Distribution Function (CDF), some samples on the 128, 256 and 512 threads workstages experience long latency, with values that exceed 10 seconds.
Starting from an object size of 512 kB, the throughput performance of both systems decreases to reach a rate of ca. 23 operations per second with objects of 5 MB (Ceph) and ca. 11 operations per second with objects of 10 MB (Ceph). This is an expected behavior that is due to two reasons:
- An increasing object size necessarily entails a decreasing number of operations per second, given a fixed amount of time and the same overall available bandwidth
- Limiting physical factors (bottlenecks) come into play and prevent the throughput to increase when the system has reached its saturation point
For what concerns these benchmarks, the bandwidth graph (below) shows that Ceph already reaches a plateau in the read bandwidth when the objects size is 128 kB for both 1 and 20 containers. Swift shows a similar behavior with 512 kB objects and 1024 kB objects for 1 and 20 containers respectively, with a more efficient behavior than Ceph when the size of the objects is 10 MB (Swift bandwidth is slightly higher in these cases).
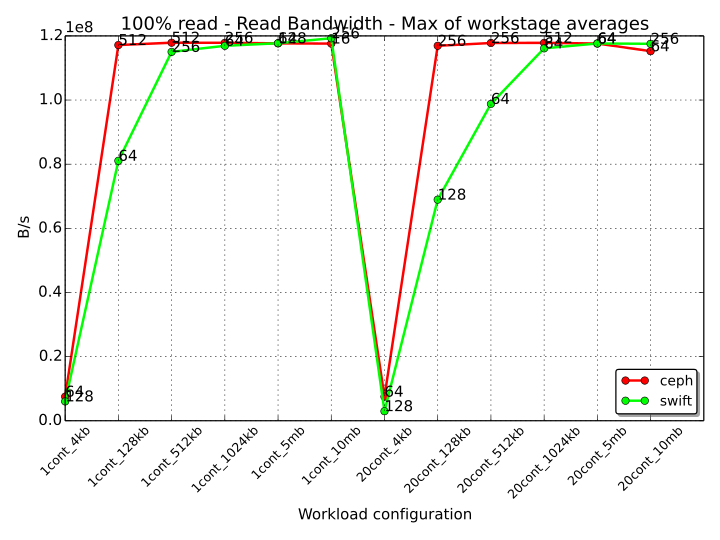
The upper bound for the bandwidth is 120 MB/s (1.2e08 B/s in the graph). This limit is below the reading bandwidth of a single disk in the system (ca. 140 MB/s), but matches the available network bandwidth of 1gb/s (125 MB/s), showing that the performance bottleneck in this small test cluster is the networking infrastructure.
When considering how the two systems scale at the increase of concurrent requests, we observe that Ceph performance doesn’t degrade as significantly as in Swift with more parallel workers accessing the storage service.
As an example of this behavior (in condition of saturation), we can consider the read throughput for 1024 kB objects over 20 containers (20000 available objects on which to uniformly distribute the workload), shown in the graph below:
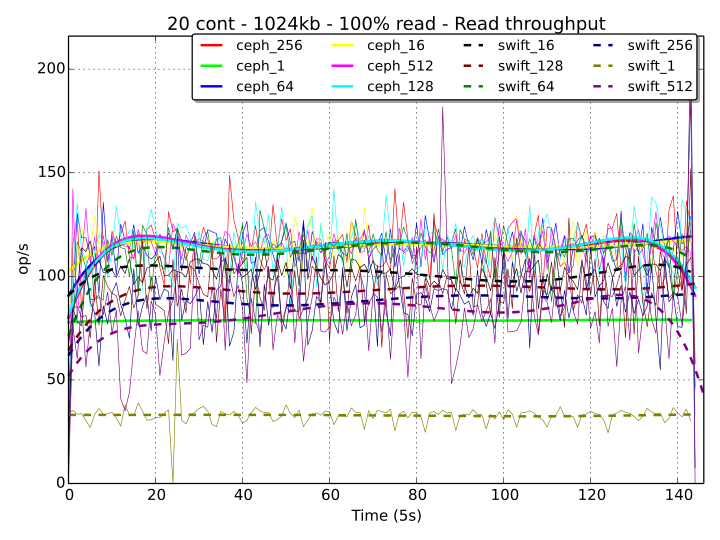
Swift obtains the best performance with 64 threads and its throughput decreases of ca. 20% when the threads are 512, denoting an already over-saturated system that cannot accommodate more requests. On the other hand, the performance for Ceph is equivalent regardless the number of threads and, even if the system is already saturated with 256 threads, when 512 workers become active, Ceph still manages to avoid starvation, as we can see in the response time diagram below.
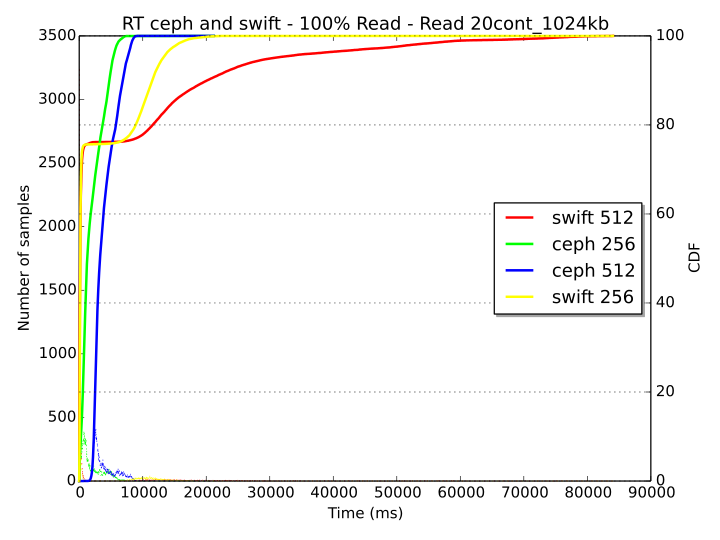
With 512 threads, Ceph has a delay of ca. 7-8 seconds at the 90th percentile, while the behavior of Swift seems more greedy, with less samples that experience a very small delay (ca. 75th percentile) and a significant portion of the remaining ones that can exceed a delay of 15 seconds (with 512 threads).
Write operations
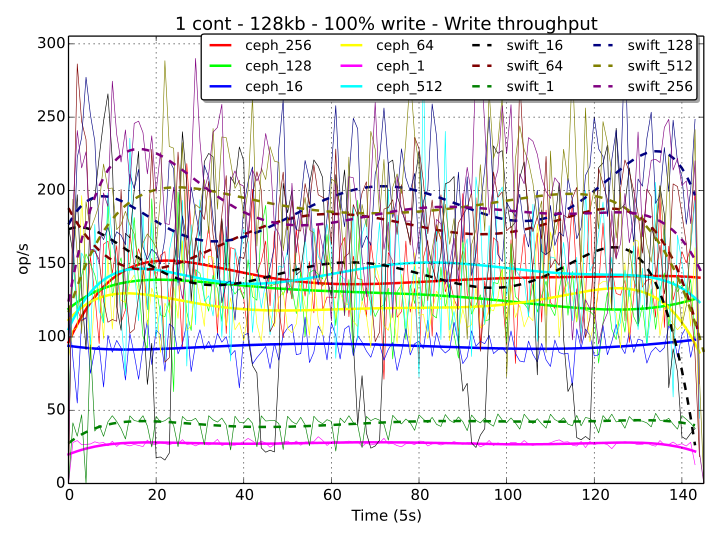
For each workload, the following diagram shows the 100% write workstage that scored the highest average throughput for each of the two storage systems (note that this diagram doesn’t take into account how Ceph and Swift manage the creation of object replicas and data consistency, a factor which will be considered later).
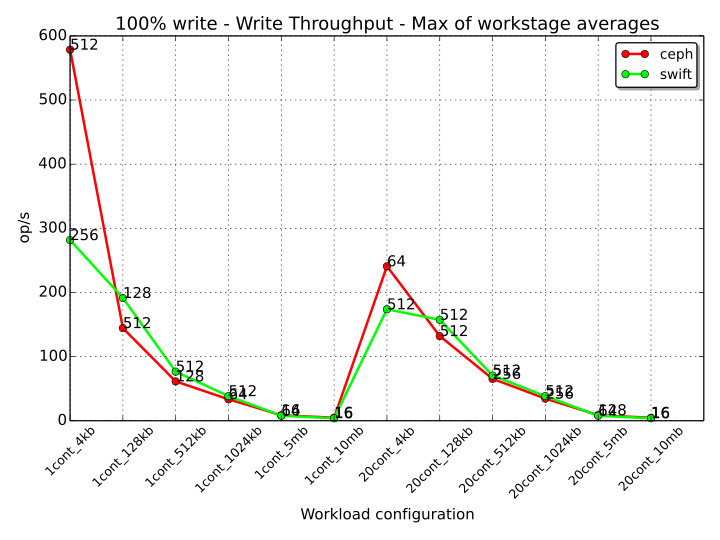
Similarly to what we have seen for the 100% read workstages, Ceph performs better when the size of the objects is small (4 kB), with a sensible difference in the “1cont_4kb” workload where Ceph almost doubles the performance of Swift (with 512 and 256 threads respectively). Both for 1 and 20 containers, Swift has a better performance with objects size of 128 kB, 512 kB and 1024 kB with a decreasing gap that tends to zero when the size of the objects is of 5 MB and 10 MB (Ceph has a slightly better throughput for these last two cases).
An interesting statistic for 100% write workstages is when Ceph and Swift are both accessed with a single thread as, in contrast with the read case, Swift performs better than Ceph. An example of this behavior can be observed in the graph below for one container and an object size of 128 kB.
For a complete analysis of the write performance, it is also interesting to consider what is the impact of writing replicas of objects.
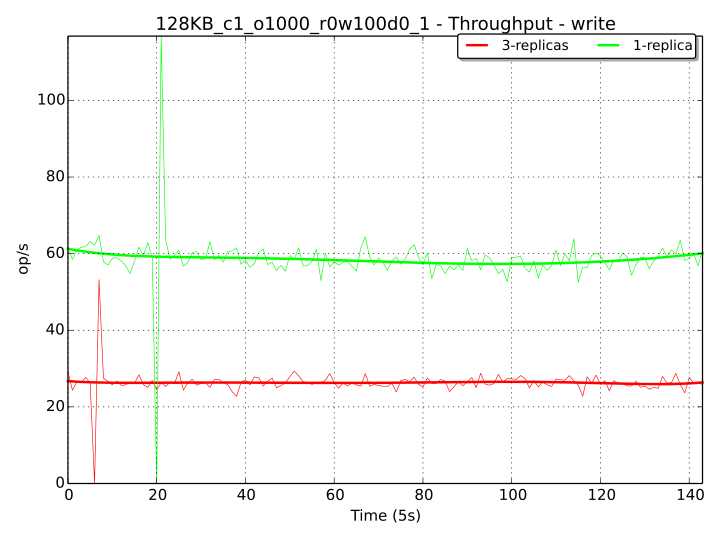
With the configuration used for the data pools of this experiment, Ceph creates three replicas of each object (so each object is copied two times) and allows I/O operations after at least two replicas have been written. Ceph is a strongly consistent system, so it will also wait until the minimum number of replicas has been written to the disks before returning a success code to the client. In Ceph, writing the transactions log to the Journal also requires some extra overhead (unless copy-on-write is used, which is not the case for xfs filesystems). Swift uses a similar approach as it streams all the 3 copies of an object to the disks at the same time and returns success when at least two of them have been correctly written.
As an example to demonstrate the difference in performance caused by writing the replicas (in Ceph), we have setup a dedicated Ceph benchmark which is identical to the “1cont_128kb” 100% write workload with one single thread, except for the fact that writing operations are performed on a special pool with a replication size of 1 (so no copies of the object other than the original instance are made). We can see from the results below that the theoretical difference that we would have expected (a 2x factor – when replicas are written to disks in parallel, starting from the 2nd copy) is precisely what we get.

In the case of 100% Write operations, the bandwidth chart is reported below.
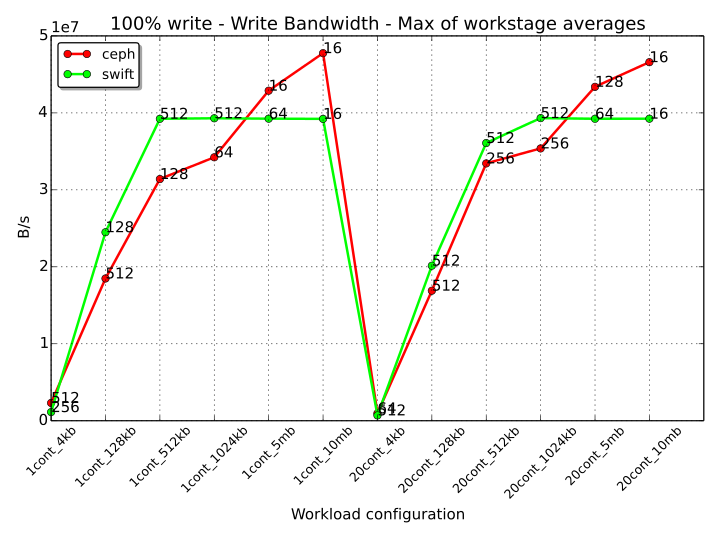
The performance of Swift reaches a maximum value of almost 40 MB/s when the objects size is bigger than 512 kB and 1024 kB respectively for 1 and 20 containers. On the contrary, Ceph performance continues to increase when the size of the object grows. Interestingly, for the same object size, Swift achieves better performance with a single container rather than with 20.
The cluster network doesn’t seem to represent a bottleneck in case of write operations.
The saturation of the system can be evaluated with the analysis of the response times. In the graph below, we can observe that for the “20cont_512kb” workload, when the number of concurrent threads is 512, the delay is ca. 10 seconds at the 90th percentile for both Ceph and Swift.
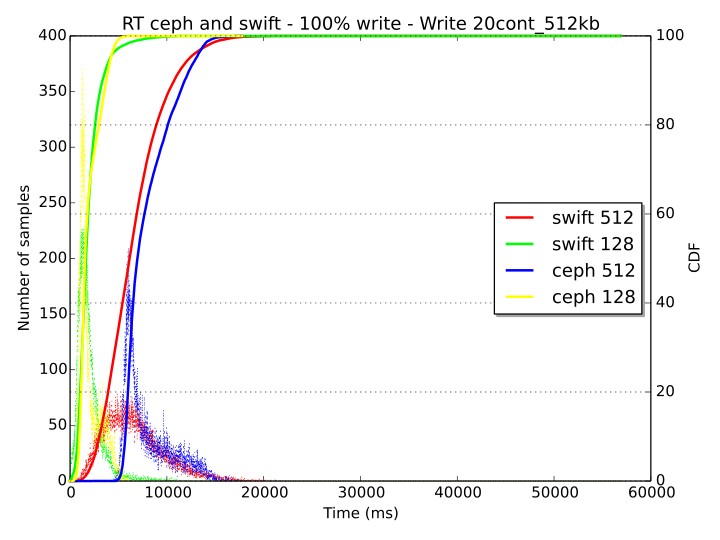
The value of delay increases to above 50 seconds for the workload with 10 MB sized objects, 20 containers and 512 concurrent workers (graph is omitted on purpose), resulting in a completely saturated system for both storage systems (with Ceph still behaving more responsively than Swift).
Mixed operations
For mixed read, write and delete traffic characterizations, every workstage has been repeated with a distribution of 80% read, 15% write and 5% delete operations.
Each different type of operation was applied the whole set of available objects and pools/containers (so every object was available at any given time to be read, written or deleted).
The graphs for the read, write and delete throughput are reported below:

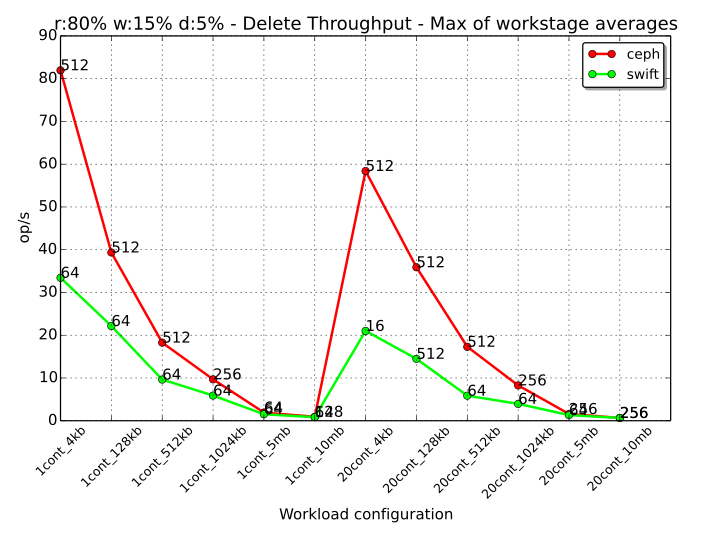
The graphs all share a similar “form” as the ratio between read/write/delete has been imposed with the workstages configuration (or better, with the configuration of works inside the workstages).
With respect to the pure write or read cases, there is an expected performance drop due to division of the workloads between different operations in the same timeslot. The proportions are obviously not maintained with respect to the 100% cases, meaning that the result that is obtained by e.g. the read operation in this mixed configuration is not the 80% of the read throughput of the pure read case. The reason for this is to be found in the interference that the other two works are causing to the execution of a single work. For reading objects, the fact that the system is busy at serving also write and delete requests, causes an increased usage of resources than if only other read requests were served. Consequently, the performance of read with respect to the 100% Read case, drops below 80%. For analogous reasons, write operations can be achieved more easily in a system that is busy only at its 20% in performing disk writes (for write works and for what may be needed by delete works).
As observed in the previous cases, Ceph has a noticeable higher throughput than Swift when the size of the objects is small, so when the number of operations is higher for both systems. The gap between Ceph and Swift decreases up to be almost nonexistent when the objects have a size of 5 MB or 10 MB.
To analyze the saturation of the system, we can refer to the response time diagrams for read operation in the “20cont_5mb” workloads:

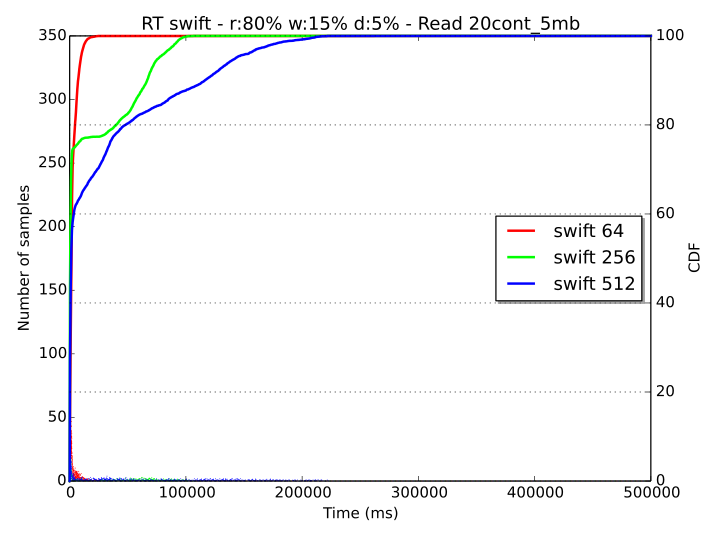
Consistently with the pure read/write cases, the performance of Ceph is more conservative than the one of Swift. With the latter, workers reach a point of starvation starting with a load of 256 threads at ca. the 75th percentile, while with Ceph, even if the system is completely saturated with 512 workers (with a stable response time of 20 seconds), all requests are served with fairness and reasonable delay up to 64 concurrent workers.
If we consider the over-saturated case of 512 threads, we can argue that Swift behavior is actually better than Ceph’s. With Swift, clients requests up to the 60th percentile are served in a short time and the rest are certainly left to timeout. With Ceph on the contrary, all requests would be served with a delay of ca. 20 seconds, probably causing a timeout for all of them.
As also observed previously, it can be noted that Swift has a more greedy behavior than Ceph, showing a very good response time performance up to a certain percentile, but with an unfair treatment of a relevant portion of the remaining samples.
Conclusions
The results for this study have been obtained with a small cluster consisting of only 3 servers, used in a configuration of 1 monitor/proxy and 2 storage nodes. Each storage server has been configured with two different and dedicated HDDs for data.
Consequently, the results here presented, even if very relevant to this context and consistent for the experiment and use case that we wanted to analyze, should not be extended to larger storage deployments that can include hundreds to thousands of OSDs.
The results here analyzed demonstrate an overall better performance of Ceph over Swift, when both systems are used for object storage (with librados for Ceph and the HTTP-based ReSTful interface for Swift).
For read operations, the most remarkable difference in throughput (number of operations per second) has been observed when accessing 20 different pools (or containers), each one containing 1000 objects of small size (4 kB). In this case, Ceph has reached a maximum average bandwidth of ca 7.5 MB/s, while Swift stopped at ca. 3 MB/s. This result, given the small time required to perform a single read operation (due to the size of the objects), would suggest a faster lookup procedure for Ceph than Swift, due to smaller overhead when performing each operation.
The difference in the read throughput decreases when the size of the object increases, to be basically zero up to a certain object size. This pattern has recurred also for write and mixed operations.
For the collection of read statistics, we have to take into account that the networking infrastructure with 1 Gbps links has represented a bottleneck that has limited the read performance of Ceph, starting with an object size of 128 kB and of Swift, starting with an object size of 512 kB (when only one container was used) and 1024 kB (when 20 containers were used).
Concerning write operations, Ceph has shown a better performance than Swift with objects of 4 kB and has produced less throughput when the size of the objects was between 128 kB and 1024 kB. For this configuration, the management of object replicas was similar for both Ceph and Swift and the difference of using a replication factor of 1 instead of 3 has been shown for Ceph and has produced expected results.
In the case of mixed read, write and delete operations, with the proportion of 80%, 15% and 5% respectively, we have observed higher throughput values with Ceph and, as in the previous cases, the difference was more pronounced when operating with smaller objects and almost zero with objects of 5 MB and 10 MB.
The response time and saturation analysis of the systems has denoted a more greedy behavior for Swift and more tendency to fairness for Ceph. While up to a certain percentile, Swift has shown faster responses to client requests than Ceph, an eventually large number of samples were left to starvation, with unacceptably long response times that would have certainly led to timeouts. Ceph on the other hand has manifested higher response times at low percentiles, but a much steeper CDF curve, implying that the majority of samples could receive a response in approximately the same time and providing for a more predictable behavior.
Related posts
- Ceph installation tutorial: Part 1 (installation), Part 2 (troubleshooting), Part 3 (testing)
Interesting to see someone comparing Ceph vs Swift performance.
I would be highly interested in the Ceph vs Swift performance degradation when putting a large amount (millions) of objects on a bit beefier hardware (e.g. when doing this you should have SSDs for the Swift container servers)..
I think it may have been a bit better to compare with RadosGW instead of writing straight to the MDS via librados. As most people would want to use an API instead of writing to the library.
(it’s actually doable to do the same thing with Swift direct_client to write straight to the obejct server without going via the proxy).
What do you mean by “writing to the library”?
sorry i meant “writing via the library, ”
librados is a library, not a REST API
and I meant ODS not MDS (confused with terminology)
Indeed, using librados instead of RadosGW makes it an
“apples and oranges” comparison.
Why would you want to compare “the best access method swift offers” to “the second best access method CEPH offers”?
Unless you’re multi-tenant or constrained by access libraries (factors that would be outside the scpe of any benchmark on raw performance), you don’t really care how the object store works, you just want it to work.
The main feature of Swift is that it is offering a widely supported REST API.
E.G. being able to serve content directly to your HTTP end users is a very big part of the core functionality.
The current benchmark is only relevant for in-house applications that you control.
I think most use cases, at least for Swift, concern internet facing access.
If not, you might as well also compare Swift performance with NFS or Samba…
Did you store the account and container databases separated from the objects (on different disks)? This can improve the performance significantly for smaller objects, especially when not using SSDs. Storing the XFS journal separate also helps.
No, they were not separated :).
What version of Swift was used here? Perhaps by “swift 2.0.3” they mean python-swiftclient?
Thank you for noticing this!
It is version 1.13.1, I fixed it in the post.
Hi Vincenzo,
First thank you for this work. It is always interesting to see different
data points from different use cases.
I noticed a couple of things and would like to ask a couple of questions
and make some observations.
Comparing a high level HTTP/REST based api (swift) to a low-level C based
api (librados) is not quite an apples to apples comparison. A more
interesting comparison, or at least another data point would be to run the
same tests with the rados gateway which provides a REST based interface. I
believe that what you attribute to differences between the performance of
the CRUSH algorithm and swift’s ring are more likely attributed to the
extra overhead of a high level interface.
An optimization is made for ceph by adding an extra disk to store the
journal, which specifically enhances the the small object performance, for
a total of 3 spindles per node. Yet, swift was only given 2 spindles per
node, thus giving ceph quite a substantial more overall IO to work with.
In several of the results, the graphs show a significant reduction of
throughput with swift going from 1 container to 20 containers with the same
sized object. In a correctly configured swift cluster, performance for
PUTs at high concurrency will always be faster with more containers.
Container operations are not part of the GET path, so the number of
containers will not effect GET performance. This leads me to believe that
either swift isn’t properly configured, or the client is doing something
non-optimal for those cases.
The eventual consistency semantics of swift are reported incorrectly. For
3 replicas, swift will stream out all 3 copies of the object to their
locations at the same time, and only return success if at least 2 of those
are successful. This is somewhat similar to the behavior of ceph.
Replication in swift is only used when there are failures.
I would also suggest expanding the data set a bit. For example, test the
performance after the system has been filled more than 50%. I would also
highly recommend testing performance when there are failures, such as a
dead disk, or one of the nodes going away.
Thanks,
—
Chuck
Thanks to everyone for the comments received so far!
One concern that has emerged is the fact that Ceph has been tested with the librados interface and Swift with the ReST-based HTTP API. For this study, this is a difference of the two systems under test and it is consequently reflected in the results that we have obtained. However, I agree that this factor must be very clear to avoid that readers are misled when reading the collected performance statistics.
I have inserted a (hopefully) very clear note at the beginning of the post to remark this configuration difference in a very visible way!
A special thanks also to Chuck for providing very useful insights about eventual consistency semantics of Swift and suggestions and considerations about the performance results. I have transposed some of your review comments in the post.
Thanks,
Vincenzo.
Hi,
Thanks for the wonderful analysis. It was quite helpful. If you don’t mind can you please share the scripts which you may have used while benchmarking this? i.e. for running different set of tests? Also was there any observation made w.r.t cpu / memory / network utilization during the test?
Hi,
No, I haven’t sampled the occupation of network, memory or CPU during the tests, unfortunately :(.
For the cosbench workloads, I generated the XML files with a script, basically each piece like the one in the gist below for each number of workers, for 1 container and for 20 containers.
Here’s the gist: https://gist.github.com/vincepii/5c8b4439fa28122dffcf
I enjoyed reading this blog. In fact I used this as an input.
I would like to have your comments on the study , I have concluded on the similar topic.
http://pushpeshsharma.blogspot.in/2014/11/openstack-swift-vs-ceph-rgw-read.html
Hi,
Below is the s3 workload xml i am using to run cosbench using s3, it is failing in s3-read/write stage with the below error.
Here, accesskey and secret key are the keys taken from s3 user creation. 10.10.100.4 is the node on which radosgw installed.
<storage type="librados" config="accesskey=M04EEO36AI1FI4TYR1Z3;secretkey=reOKHTvmb1g1E5c15brqmzIhwe2vUlyKKVjszIi3;proxyhost=10.10.100.4;proxyport=7480;endpoint=http://10.10.100.4:7480” />
Error log shows:
2016-06-15 12:45:10,611 [INFO] [NoneStorage] – performing PUT at /s3testqwer1
2016-06-15 12:45:10,615 [WARN] [S3Storage] – below exception encountered when creating bucket s3testqwer1: Unable to unmarshall error response (Content is not allowed in prolog.)
2016-06-15 12:45:18,543 [INFO] [NoneStorage] – performing PUT at /s3testqwer1/myobjects1
2016-06-15 12:45:18,546 [WARN] [S3Storage] – below exception encountered when creating object myobjects1 at s3testqwer1: Unable to unmarshall error response (Content is not allowed in prolog.)
Can some one guide me on how to run cosbench for s3.
Hi,
When a rgw service is started, by default below pools are created.
.rgw.root
default.rgw.control
default.rgw.data.root
default.rgw.gc
default.rgw.log
When a swift user is created, some default pools are created. But I would like to use “Pool_A” for the swift user.
From client when I run Cosbench the data should be placed in “Pool_A” instead of placing it in default pools. How can i achieve that.
Also need help on how to run Cosbench with swift user. Your help is very much appreciated.
Thanks,
kanchana.
You stated:
“Some adaptations were required …for letting COSBench use pre-provisioned pools”
Can you elaborate on what you did to achieve this? Was it just omitting work stages in the XML script. If you could provide an example that would be great.