In some of our projects we need to understand the energy consumption of our servers in an Openstack cluster. The first step in this process was to collect energy consumption data from our IBM servers; we stored this in Ceilometer for further study. In this blog post we will cover how we do this.
First, Kwapi 101.
Kwapi is a part of the openstack ecosystem (perhaps a little peripheral) which is focused on collecting energy data. It has pretty good integration with Ceilometer which enables the energy data to be stored there.
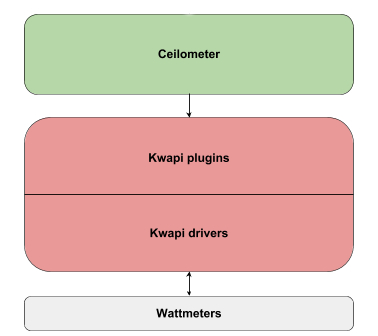
Kwapi is architected in such a way that individual drivers listen to a specific wattmeter – a wattmeter can be a physical energy meter with a wifi interface or connected to ipmi, i.e. any kind of device that measures energy consumption. The drivers then pass the information on to plug-ins. These are the API, the forwarder and the RRD plugin which is the visualization plugin that provides a web interface with power consumption graphs.
The API listens to the forwarder endpoint and collects data – it also provides an outbound interface to enable other entities e.g. Ceilometer to get this data. The purpose of the forwarder is to reduce network traffic by duplicating the metrics and sending only once if multiple plugins listen to the same driver; use of the forwarder is optional, If the drivers and the plugins are running on the same machine it is not necessary to use the forwarder. The architecture is shown in the figure below.
Following that basic introduction, we now describe how we set it up.
Our IBM x-series servers (x3550 M4 to be precise) provide the energy consumed via a sysfs interface to the ibmaem module; the energy consumed is stored in a dynamically updated file that gives the number of Joules consumed since the system was powered up – the amount of energy consumed by a task can be calculated by taking the difference between before and after readings.
The commands below show how we set up the servers to collect the energy consumed. The first step was to load the ibmaem module and install lm-sensors to read the power and energy sensors.
--Install lm_sensors
# apt-get install lm-sensors
--Load the module
# modprobe ibmaem
-- Scan your system and detect hardware monitoring chips
# sensors-detect
Once these have been installed successfully the state of the system’s sensors can be seen:
[root@node-1 ~]# sensors
aem2-isa-0000
Adapter: ISA adapter
temp1:       +22.0°C
temp2:       +21.0°C
power1:     161.56 W  (interval =   1.00 s)
power2:     144.67 W  (interval =   1.00 s)
power3:      26.00 W
power4:     427.00 W
power5:     419.00 W
power6:     413.80 W
power7:     293.80 W
energy1:      1.81 GJ
energy2:      2.30 GJ
The ibmaem module provides the power and energy sensor readings where energy2 gives a readout of the rack-mounted servers and energy1 for blade servers; the file where this data is stored can be found in /sys/devices/platform/aem.1/energyX_input, where X is 1 for blade servers and 2 for rack-mounted.
On Ubuntu setting up kwapi requires going through the following steps.
First, install some basic packages:
# apt-get install python-dev python-zmq python-rrdtool libxml2-dev libglib2.0 librrd-dev
# pip install greenlet babel prettytable stevedore netaddr
Then download and install Kwapi from the repository:
# git clone https://github.com/stackforge/kwapi.git
# cd kwapi
# ./setup.py install
NOTE: While we show the process for ubuntu above, in our main deployment we use CentOS6.5 and had issues with the package manager yum and the rrdtool dependencies – we solved it by removing rrdtool from the dependencies needed by Kwapi in the file kwapi/requirements.txt.
After installing Kwapi, copy the configurations file to /etc and create the log files, as follows:
# cp -r etc/kwapi /etc/
# mkdir /var/log/kwapi
# touch /var/log/kwapi/kwapi-api.log
# touch /var/log/kwapi/kwapi-drivers.log
# touch /var/log/kwapi/kwapi-forwarder.log
Kwapi already has some drivers pre-configured (IPMI, SNMP, Wattsup) but it also supports the addition of new drivers.; the dummy driver is a good start to have a better comprehension of how it works. To activate a driver add it to /etc/kwapi/drivers.conf with all necessary parameters.
After configuring Kwapi, start the services:
# kwapi-api
# kwapi-drivers
# kwapi-forwarder
Ceilometer already supports Kwapi, it is just necessary to tell Ceilometer where kwapi is. This involves setting up the service and endpoint in keystone as follows:
# keystone service-create --name=Kwapi \
                          --type=energy \
                          --description="Kwapi Energy Monitor"

+-------------+----------------------------------+
|   Property  |              Value               |
+-------------+----------------------------------+
| description | Kwapi Energy Monitor             |
| id          | 15c11a12312e427e91bc41231b45f4bd |
| name        | Kwapi                            |
| type        | energy                           |
+-------------+----------------------------------+
# keystone endpoint-create --region=RegionOne \
                           --service-id=service_id \
                           --publicurl=http://10.0.0.1:api_port/v1 \
                           --internalurl=http://10.0.0.1:api_port/v1 \
                           --adminurl=http://10.0.0.1:api_port/v1

+-------------+-----------------------------------+
|   Property  |             Value                 |
+-------------+-----------------------------------+
| adminurl    | http://10.0.0.1:api_port/v1       |
| id          | 11f9c625a4324a3f8e66bf4e5dadf213  |
| internalurl | http://10.0.0.1:api_port/v1       |
| publicurl   | http://10.0.0.1:api_port/v1       |
| region      | RegionOne                         |
| service_id  | service_id                        |
+-------------+-----------------------------------+
When a new service is created a service id is assigned by keystone, this id must be used in the endpoint-create call in service_id field.
Then change file /etc/ceilometer/pipeline.yaml and create a new source to recognize the energy meter – here is how we did it:
- name: meter_energy
interval: interval
meters:
- "power*"
- "energy*"
sinks:
- meter_sink
Note that interval is the time between which ceilometer will query the API and collect the samples in seconds – an interval of 60 will collect a sample from kwapi every minute. Note that the drivers themselves have their own sampling interval, so care should be taken when configuring this to ensure that there are not significant inconsistencies between these values.
Restart the Ceilometer central agent service.
# service openstack-ceilometer-agent restart
Following these steps the energy consumption is retrieved by the Kwapi API and stored in Ceilometer – this can be seen below.
# ceilometer meter-list

+-------+-----------+-----+--------------------+-----------+-----------+
| Name  | Type      | Unit| Resource ID        | User ID   | Project ID|
+-------+-----------+-----+--------------------+-----------+-----------+
| energy| cumulative| kWh | node-41.domain.tld | None      | None      |
| power | gauge     | W   | node-41.domain.tld | None      | None      |
+-------+-----------+-----+--------------------+-----------+-----------+
We can see some of the samples below:
# sample-list -m power -q “resource=node-41.domain.tld”

+-------------------+------+--------+------+----------------------------+
| Resource ID       | Name | Volume | Unit | Timestamp                  |
+-------------------+------+--------+------+----------------------------+
| node-41.domain.tld| power| 173.0  | W    | 2014-08-14T07:25:45.023000 |
| node-41.domain.tld| power| 169.0  | W    | 2014-08-14T07:25:34.908000 |
| node-41.domain.tld| power| 169.0  | W    | 2014-08-14T07:25:24.760000 |
| node-41.domain.tld| power| 174.0  | W    | 2014-08-14T07:25:14.646000 |
| node-41.domain.tld| power| 174.0  | W    | 2014-08-14T07:25:14.646000 |
| node-41.domain.tld| power| 172.0  | W    | 2014-08-14T07:25:04.532000 |
| node-41.domain.tld| power| 168.0  | W    | 2014-08-14T07:24:54.418000 |
| node-41.domain.tld| power| 170.0  | W    | 2014-08-14T07:24:44.269000 |
| node-41.domain.tld| power| 174.0  | W    | 2014-08-14T07:24:34.154000 |
| node-41.domain.tld| power| 173.0  | W    | 2014-08-14T07:24:24.037000 |
| node-41.domain.tld| power| 173.0  | W    | 2014-08-14T07:24:24.037000 |
| node-41.domain.tld| power| 169.0  | W    | 2014-08-14T07:24:13.922000 |
| node-41.domain.tld| power| 168.0  | W    | 2014-08-14T07:24:03.808000 |
| node-41.domain.tld| power| 174.0  | W    | 2014-08-14T07:23:53.691000 |
| node-41.domain.tld| power| 169.0  | W    | 2014-08-14T07:23:43.585000 |
+-------------------+------+--------+------+----------------------------+
The energy consumed, measured in Watts, is in the Volume field and there is a timestamp which indicates when the sample was taken by Kwapi.
Et voila – you’ve now set up Kwapi with Ceilometer and you can monitor the energy consumption of your Openstack cluster.
If you’re interested in this topic, you may be interested in some of our other blog posts:
- A Web Application to Monitor and Understand Energy Consumption in an Openstack Cloud
- Understanding the relationship between ceilometer processor utilisation and system energy consumption for a basic scenario in Openstack
- Migration of Ceilometer Energy Consumption Data from Havana/MySQL to Icehouse/MongoDB
Dear Sir/Madam,
Thank you for posting an interesting article. However, I have few comments.
Firstly, energy consumption should be expressed in kWh, not in W(atts).
Secondly, Is there any way to tight the energy consumption with a tenant id (project id), not resource id (node id)?
I would be greateful for a reply,
Best regards,
Damian Kaliszan
Poznan Supercomputing and Networking Centre
Hi Damian,
Kwapi has a built-in function that calculates the energy consumption in kWh. Basically, providing the energy consumption in Watts 2 new meters are created in Ceilometer, energy and power, which represent W and kWh respectively.
Unfortunaltely there is no proper way to tight the energy consumption to a project. Kwapi only associates the energy consumption to a ResourceId (server) and the fields ProjectId and UserId are usually null as multiple projects and users may use that server.
I’m sure that there is different ways to achieve what you want to reach but so far I couldn’t see this implemented in kwapi. For example, it’s possible to estimate the energy consumption of a project if you get the resource usage, e.g. CPU, Memory or/and Disk, of each VM belonging to a project running in the server and compare with the overall usage of that server.
BR.
Hello
I am installing kwapi on a devstack environement and for restarting the ceilometer-agent service i am doing a rejoin-stack.
But i am not having the new meters when i run the command ceilometer meter-list after the rejoin-stack.
Is there another way to restart the ceilometer service , or what i have to do to have the new meters in the ceilometer meter list .
Best regards
Ahmad KHALIL
Hi Ahmad,
Ceilometer services, as any other OpenStack service, run on screens in a Devstack environment. To restart ceilometer services without unstack/rejoin-stack you just need to run the command
screen -rand switch among screens pressing “CTRL+A N”. When you finally find the service you want to restart exit the process pressing CTRL+C and the “up” arrow + Enter to start it again. Finally to return to your environment press “CTRL+A D”.Regarding the meters not showing up in meter list, the meter will only appear in case your drivers are working and collecting energy information. I would suggest you to create a new “dumb driver” which generates random values just for testing purposes, then you can set up your own drivers after everything is working properly.
Best,
Bruno.
Helllo,
Your post is very intéresting.
so I am testing autoscaling with heat and ceilometer .For the ceilometer alarm I would like to use the outputs of a shell script( like a function which return a number and the scale up/scale down will depends on this number according to ceilometer)
So how can I manage the communication betwen my shell script and ceilometer?
Hi,I am a student.I have installed lm_sensors in Centos7.However,I only get the information as follows:
[root@controller usr]# sensors
coretemp-isa-0000
Adapter: ISA adapter
Physical id 0: +46.0°C (high = +84.0°C, crit = +94.0°C)
Core 0: +43.0°C (high = +84.0°C, crit = +94.0°C)
Core 1: +46.0°C (high = +84.0°C, crit = +94.0°C)
Core 2: +43.0°C (high = +84.0°C, crit = +94.0°C)
Core 3: +43.0°C (high = +84.0°C, crit = +94.0°C)
coretemp-isa-0001
Adapter: ISA adapter
Physical id 1: +44.0°C (high = +84.0°C, crit = +94.0°C)
Core 0: +43.0°C (high = +84.0°C, crit = +94.0°C)
Core 1: +44.0°C (high = +84.0°C, crit = +94.0°C)
Core 2: +42.0°C (high = +84.0°C, crit = +94.0°C)
Core 3: +43.0°C (high = +84.0°C, crit = +94.0°C)
No energy information.Please help me,but why?what should I do?please help me…
Hi。。。please help me。。I do not understand the loading the ibmaem..so I can not get the information about energy…please help me
The ibmaem module is resposible for collecting energy/power consumption in IBM machines, as you are unable to retrieve these metrics via this module you could try to use the ipmitool.
It is worth mentioning that this work was done almost 3 years ago and most likely requires some changes in order to integrate it with newer Openstack versions (Mitaka, Newton, etc).
I just use the lm_sensor not the openstack.
sorry.The servers I am using is not IBM,they are Inspur.
ipmitool may not acquire the information about energy…what can i should do?
There is a way to collect energy metrics using files from /sys/class/power_supply/BAT0/. There are a good set of files there, if you are lucky enough there will be one named ‘power_now’. Otherwise you would have to find another way to measure it. Have a look here: https://unix.stackexchange.com/questions/10418/how-to-find-power-draw-in-watts.
These are some pointers on how to collect this metric but I never tested it myself. Hope this gives the information you are looking for.
Thank you very much!
[root@controller ~]# cd /sys/class/power_supply/
[root@controller power_supply]# ll
total 0
It has none…What I want to ask,whether I configure less,so I can not get the eneygy information.
I have run the commang ipmitool:
#ipmitool sensor
ME_PMBPower | na | Watts | na | na | na | na | na | na | na
this display the power but no digits???
I have load the ibmaem,but I can not get the information about the energy..please help me…I am in hurry