Since our servers have been set up for live migration with Openstack Icehouse, we wondered how live migration would perform. We measured the duration of the migration process, VM downtime duration and the amount of data transfered via the ethernet during a live migration. All tests were performed across 5 different VM flavors to examine the impact of the flavor. Another point we were curious about is how higher memory load of VMs can impact migration performance. Here, we present the results of our experiments which show how live mgration works in these different scenarios.
System configuration:
- 1 controller node (IBM x3550 m4 – 2 Xeon processors, 192 GB RAM, 2.7 TB storage)
- 2 compute nodes (2x IBM IBM x3550 m4 – 2 Xeon processors, 192 GB RAM, 2.7 TB storage)
- GbE LAN Network
- QEMU 1.2.1
- Libvirt 0.10.2
- Block live migration setup – no shared file system configured
Flavors’ description: 
The Openstack installation supports the following standard flavors.
| Flavor | VCPUs | RAM | Disk |
| t | 1 | 512 | 1 |
| s | 1 | 2048 | 20 |
| m | 2 | 4096 | 40 |
| l | 4 | 8192 | 80 |
| xl | 8 | 16384 | 120 |
Table 1: Description of used flavors
Key metrics for migration
When migrating VMs from one host to another there are three specific metrics which are of most interest. These are:
- Migration time: Total migration time (in seconds) from initialization of the migration process at the source node until successful completion of the migration at the destination node. This information is stored in /var/log/nova-all.log file on the computing nodes.
- VM Down time: Time period during which VM does’t reply to ICMP echo request from remote host. Total downtime is counted by summing of all lost packets multiplied by request’s interval. We set up the the interval between 2 consecutive ICMP packets to 200 ms; this may result in up to 400 ms error in the result of each test. However, since measured down times are much greater than 400 ms, this method provides relatively accurate results for our purposes.
- Total amount of data transferred: Amount of data transfered from source to destination host during migration process via the network measured in MB. We used the iftop tool to measure transferred data during the migration process.
Migration of loaded and unloaded VMs
It is known that the amount of time taken to perform a live migration is dependent on the activity of the VM – if the VM is very active, it takes longer for the migration process to transfer the VM’s memory. For this reason, we performed experiments with both unloaded and loaded VMs to determine how much of an impact this has. Consequently, we performed experiments with:
- Unloaded VM: VM running Ubuntu 14.04 LTS: it was essentially unloaded during the migration process.
- VM with memory-intensive load: VM running Ubuntu 14.04 LTS and the stress tool which generated a stable memory load during migration.We adjusted size of stressed memory based on VM memory size (VM flavor) such that stress tool consumed approximately 75% of the VM’s memory.
Performance tests
We performed experiments to measure the key metrics identified above. Here, we present the results.
| VM Flavor | t | s | m | l | xl |
| Unloaded VM | 9.4 | 20.5 | 25.4 | 24.1 | 37.5 |
| Loaded VM | 9.6 | 29.9 | 30.1 | 84.4 | 152.3 |
Table 2: Migration duration (s) for different flavors – loaded and unloaded
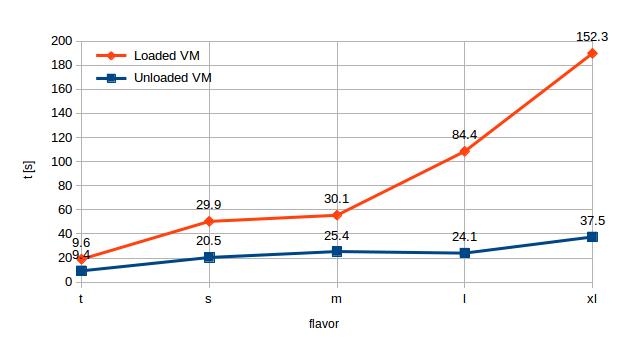
There is significiant difference between the time required to perform migration of loaded and unloaded VMs; further this difference increases with size of the VM. The difference between migration time of a loaded and unloaded tiny flavor VM is only 0.2 s (102% of the time taken in the unloaded case) while the same difference in case of extra-large flavor is 114.8 s (406% of the time take in the unloaded case).
The results show that there is not a significant increase of migration time for the unloaded VMs as the flavor size increases: the curve for the migration time of the unloaded VMs increases slowly even though there is a big difference in memory size of the different flavors. In contrast, the curve is much steeper for the loaded VMs, showing that migration time increases significantly as memory size increases. These observations indicate that reducing VM memory load can lead to faster live migrations.
| VM Flavor | t | s | m | l | xl |
| Unloaded VM | 3.0 | 5.4 | 6.8 | 13.7 | 21.5 |
| Loaded VM | 4.2 | 18.6 | 17.9 | 62.8 | 115 |
Table 3: VM downtime (s) for different flavors – loaded and unloaded
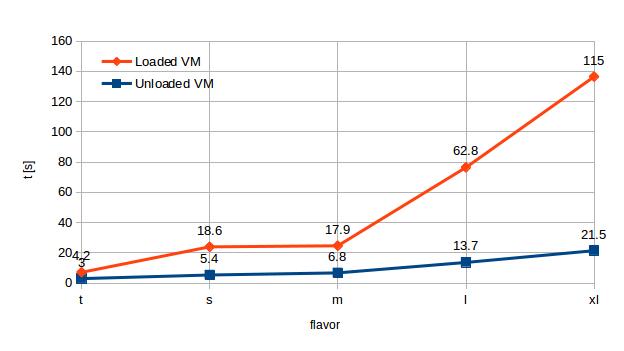
Most of the experiments show a strong corelation between VM downtime and migration duration as would be expected. The larger loaded VMs exhibit downtime of up to 75% of whole migration time. In most cases with memory load, downtime exceeds half of the migration time. Clearly, this is not negligible, especially for mission critical services – if live migration is to be used for such services, it needs to be used with care.
| VM flavor | t | s | m | l | xl |
| Unloaded VM | 468 | 760 | 1030 | 1900 | 3200 |
| Loaded VM | 468 | 760 | 1030 | 8000 | 14700 |
Table 4: Total data transferred during live migration – loaded and unloaded VMs
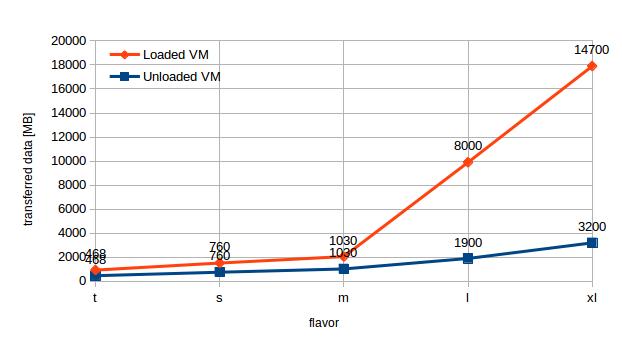
There was no measurable difference concerning network data transfer between loaded and unloaded VMs for the smaller flavors (tiny, small and medium) . This is probably caused by a sufficiently fast Gbit LAN network connecting the hosts. For these smaller configurations, then, we can expect similiar performance from block live migration as from live migration requiring shared storage. Beyond this configuration, however, the ethernet network with its throughput constraint probably becomes the slowest part of the migration chain and introduces delays.
We note two key takeaways from these experiments. These are:
- Downtime for these live migrations ranges from a few seconds to a few hundred seconds; similarly total migration time falls within these ranges
- There is a significant difference between the time required to perform live migrations for unloaded VMs and those which have a memory intensive load – our results indicate that the latter can take 4-5 times longer than the former.
Live migration is quite widely used in some contexts – in Openstack it is not yet mature. We hope these results can help people understand the implications of using live migration in production Openstack environments. In future work, we will look at both how this can be used as well as trying to determine approaches to optimize it.
Update: We continued our work and published new blog post concerning performance of openstack live migration with NFS configured between compute nodes.
It will be interesting to repeat the measurment with high ttraffic conditions . The measures shown here can be retrieved by correctly simulating the environment. High traffic conditions and DC workload condition, needing migration for energy goals, should show different behavior of the performance of live migration. In particular the new tests will identify non-linear behaviour of the system which is the important aspect.
Hello,
that’s right! We’ve just published new blog post concerning using Openstack live migration under various CPU and network load.
Very good improvement of the analysis of performance on block migration. Now the discontinuity found in almost all cases in high load conditions, i would suggest, should be translated in impacts on the availability % declared in the SLA and related costs for SLA violations. For example, this new analysis would also hield the max number of migrations & policy without impacting the SLAs.