As system administrators it is difficult to gather performance data before going productive. Benchmarking tools offer a comfortable way to gather performance data by simulating usage of a productive system. In the OpenStack world we can employ the Mirantis Rally tool to benchmark VM performance of our cloud environment.
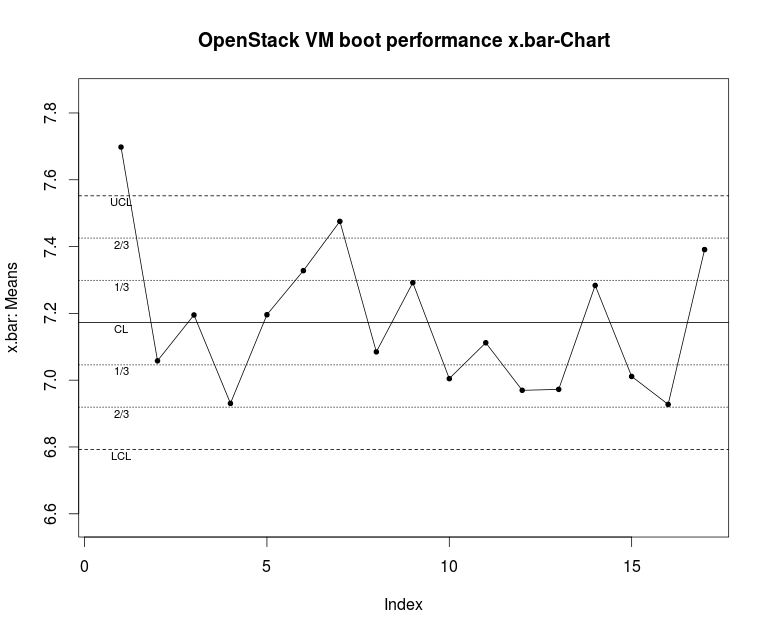
Rally comes with some predefined benchmarking tasks like e. g. booting new VMs, upstarting VMs and running shell scripts on them, concurrently building new VMs and many more. The nice drawing below shows the performance of booting VMs in an OpenStack instance in a Shewhart Control Chart (often called “X-Chart” or “X-Bar-Chart”). As you can see it takes almost 7.2 seconds to upstart a VM on average and sometimes the upstarting process is outside the usual six sigma range. For a system administrator this could be quite useful data.
The data above was collected employing the Rally benchmark software. The Python-based Rally tool is free, open-source and extremely easy to deploy. First you have to download Rally from this Github link.
Rally comes with an install script just clone the Github repository in a folder of your choice, cd into that folder and run:
$ ./rally/install_rally.shThen deploy Rally by filling your OpenStack credentials in a JSON-file:
And then type:
$ rally deployment create --filename=existing.json --name=existing
+----------+----------------------------+----------+-----------------+
|   uuid   |         created_at         |   name   |      status     |
+----------+----------------------------+----------+-----------------+
|   UUID   | 2014-04-15 11:00:28.279941 | existing | deploy-finished |
+----------+----------------------------+----------+-----------------+
Using deployment : UUID
Remember to use the UUID you got after running the previous command.
Then type:
$ rally use deployment --deploy-id=UUID
Using deployment : UUID
Then you are ready to use Rally. Rally comes with some pre-configured test scenarios in its doc-folder. Just copy a folder like e. g. rally/doc/samples/tasks/nova/boot-and-delete.json to your favourite location like e. g. /etc/rally/mytask.json:
$ cp rally/doc/samples/tasks/nova/boot-and-delete.json /etc/rally/mytask.json
Before you can run a Rally task, you have to configure the tasks. This can be done either via JSON- or via YAML-files. The Rally API can deal with both file format types.
If you edit the JSON-file mytask.json, you see something like the following:
{
    "NovaServers.boot_and_delete_server": [
        {
            "args": {
                "flavor_id": 1,
                "image_id": "Glance UUID"
            },
            "runner": {
                "type": "constant",
                "times": 10,
                "concurrency": 2
            },
            "context": {
                "users": {
                    "tenants": 3,
                    "users_per_tenant": 2
                }
            }
        }
    ]
}
You have to add the correct UUID of a Glance image in order to configure the test run properly. The UUID can be retrieved by typing:
$ rally show images
+--------------------------------------+--------+----------+
|                 UUID                 |  Name  | Size (B) |
+--------------------------------------+--------+----------+
| d3db863b-ebff-4156-a139-5005ec34cfb7 | Cirros | 13147648 |
| d94f522f-008a-481c-9330-1baafe4933be | TestVM | 14811136 |
+--------------------------------------+--------+----------+
Update the mytask.json file with the UUID of the Glance image.
If we want to run the task simply type (the “-v” flag for “verbose” output):
$ rally -v task start /etc/rally/mytask.json
=================================================================
Task  ... is started
------------------------------------------------------------------
2014-05-12 11:54:07.060 . INFO rally.benchmark.engine [-] Task ...
2014-05-12 11:54:07.864 . INFO rally.benchmark.engine [-] Task ...
2014-05-12 11:54:07.864 . INFO rally.benchmark.engine [-] Task ...
...
+--------------------+-------+---------------+---------------+
|       action       | count |   max (sec)   |   avg (sec)   |
+--------------------+-------+---------------+---------------+
|  nova.boot_server  |   10  | 8.28417992592 | 5.87529754639 | |
| nova.delete_server |   10  | 6.39436888695 | 4.54159021378 |
+--------------------+-------+---------------+---------------+

---------------+---------------+---------------+---------------+
   avg (sec)   |   min (sec)   | 90 percentile | 95 percentile |
---------------+---------------+---------------+---------------+
 5.87529754639 | 4.68817186356 | 7.33927609921 | 7.81172801256 |
 4.54159021378 | 4.31421685219 | 4.61614284515 | 5.50525586605 |
---------------+---------------+---------------+---------------+

+---------------+---------------+---------------+---------------+
|   max (sec)   |   avg (sec)   |   min (sec)   |  90 pecentile |
+---------------+---------------+---------------+---------------+
| 13.6288781166 | 10.4170130491 | 9.01177096367 | 12.7189923525 |
+---------------+---------------+---------------+---------------+...
...
The statistical output is now of major interest: it shows how long it takes to boot a VM instance in OpenStack and gives some useful information about the performance of your current OpenStack deployment. It can be viewed as a sample in the Shewhart control chart. Rally takes 10 test runs and measures the average runtime of each run. This technique is called statistical sampling. So each Rally run can be viewed as a sample which is represented as one data point in a control chart.
But how did we get our data into a Shewhart Control chart? This will be explained further in part 2.
Nice post, btw now rally has ability to plot graphs out of box
Try to run:
rally task plot2html –out somewhere.html
You can easily export the output to an html file. Like below
rally task report 5686272f-1ad7-4d88-98d5-1e7e692b4426 –out output.html