In an increasingly self-aware and knowledge-driven software world, understanding the execution behaviour of an application is mandatory for cost-effective delivery. This applies especially to cloud functions, because many complex applications are composed of those functions. Similar short-lived, event-driven processing models can be found inside databases and message brokers. This means systematic tracing of cloud functions should be conducted so that a large variety of applications benefits from rightsizing memory allocation and associated fair microbilling.
We recently reported on our upcoming presentation on generating static trace profiles for cloud functions. In general, tracing techniques help reporting with high precision how much memory an application requires. But in practice, the memory needs depend on a number of factors that change over time. Similar to how static environment variables have been replaced by dynamic queries to updateable key-value stores to increase dynamics, we should be able to produce dynamic traces that show at least a correlation to certain values within the function, like the number of rows in a table. This research blog post shows one approach to do that.
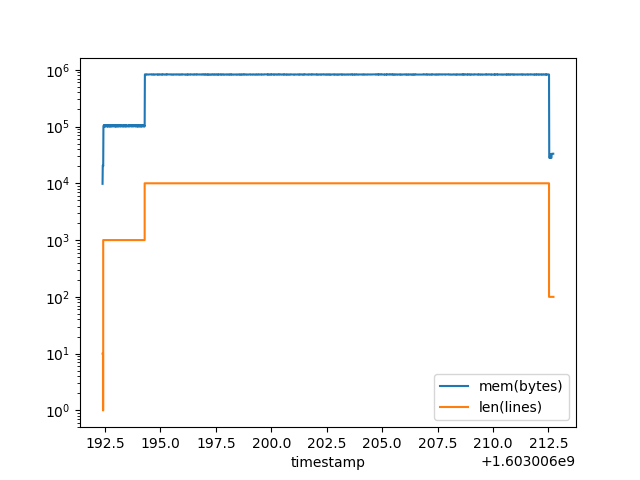
Given that many cloud functions are written in programming languages that allow for dynamic in(tro)spection, one technique is to create a wrapper function that executes the actual function code in a second thread. The main thread performs a parallel measurement of the consumed memory and event-triggered peeks into the local variables, including the input parameters, of the executed function. The figure above shows that this works in principle. Using the tracemalloc module of Python, an application processing lines in text files is observed, and the memory consumption is found to be directly proportional to the number of lines in each file, represented through a local lines variable. An excerpt of an exemplary function, abstracted from a concrete FaaS syntax, is shown below.
def mainfunction():
    datfiles = glob.glob("*.dat")

    for datfile in datfiles:
        print(datfile)
        tx = time.time()
        f = open(datfile)
        lines = f.readlines()
        ....
Correlation is not causation, and thus the assignment of any value to the lines variable does not necessarily imply that the memory needs are a result of the assignment being executed. Rather, the preceeding readlines call pumps data into the memory, and the only way to know that beforehand is to inspect the f variable. Tracing the entire function execution is costly – doing so only in a learning/training phase, and then using selective breakpoints (for instance just after assigning the value of f) suggests that a high-performance solution may be available.
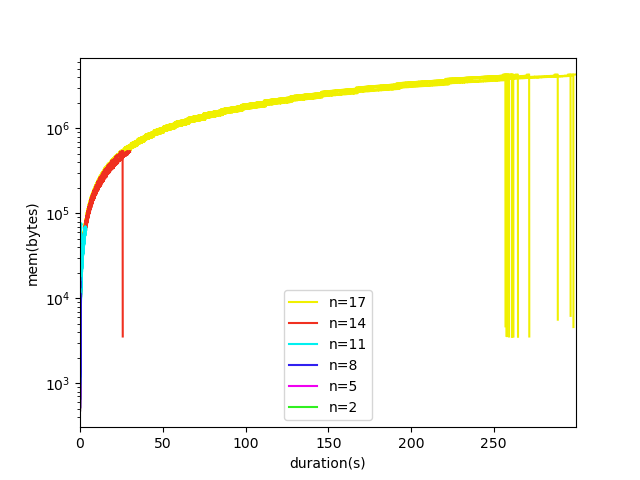
Is this only working with a locally executed function as shown above? No. Another function whose execution time and memory consumption depends on a randomly generated variable is deployed to Google Cloud Functions and traced while executing there. The correlation between the variable and the memory consumption is crystal-clear, as indicated by the next figure (note log scale on the y axis). The dropping lines by the end of each spectrum signal that the function execution has just ended whereas the memory is measured one more time before the wrapper terminates as well.
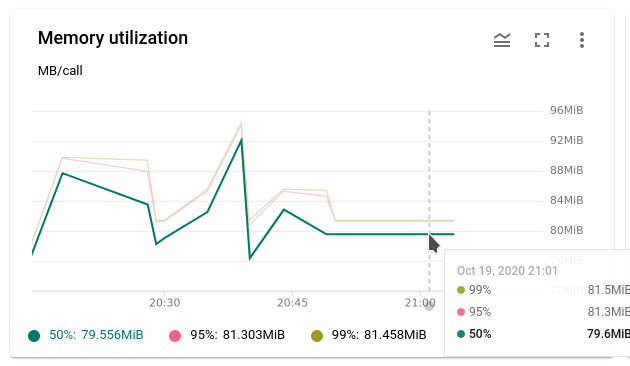
This contrasts the standard memory measurements in Google Cloud Functions (and similar ones by other providers) that give basic statistical distributions on memory consumption, but do not break this down to per-function instance and especially not to any variable values during the execution. A screenshot is shown below. The Google Cloud Monitoring/Stackdriver APIs give a few more metrics, but again not the same level of detail and real application-level insights.
While the work explained here is preliminary research, the early results are promising that by combining function wrapping with tracing, machine learning, breakpoint injection and dynamic vertical scalability features of the underlying execution architectures, application engineers will be able to determine more precisely how much memory was spent by the software in operation. And especially, why. We will continue to investigate with the aim of bringing the best serverless and cloud-native technologies to a broader market.