Supply chain network disruptions have become an increasingly relevant topic in literature and industry. Just recently the COVID-19 pandemic demonstrated the need for greater resilience in global supply chain networks. Disruptions lead to material shortages adversely impacting demand fulfilment and eventually resulting in operational shutdowns of nodes or edges in the network. Due to the interconnectedness of modern supply chain networks, such impacts may not be contained to one part of the network but cascade through the network, which is known as the ripple effect or risk propagation. The inherent complexity of today’s supply chain networks and the associated dynamics of the ripple effect increase the difficulty to predict and manage disruptions. The unavoidable and unpredictable nature of disruptions requires the ability of supply chain networks to prepare to, respond to, and recover from a disruption. Supply chain networks with such capabilities are called resilient. Current Supply Chain Network Resiliency (SCNR) literature is assuming homogeneous node risk capacities and is mainly focused around network types, proposing methods that are impractical for supply chain management (SCM) practitioners, such as rebuilding an entire network into a certain structure, which is not possible in practice. Further, it is too expensive for practitioners to simply enhance risk capacity of every node in the network.
The Sustainable Supply Chain Management team of the Institute of Sustainable Development fills this research gap by exploring a novel way to identify critical nodes in supply chain networks, which are then to be fortified to increase overall network resiliency. We present a quantitative social network analysis (SNA) based approach to selectively fortify nodes in complex supply chain networks, targeting ripple-effect mitigation and enhancing supply chain network resilience (SCNR). Our model can be used to analyze supply chain resilience and derive strategies to mitigate disruptions, specifically using betweenness centrality for fortification. The model can be applied by supply chain managers to existing supply chain networks.
To find and evaluate an efficient selection logic, we choose a quantitative approach using agent based simulation. First, an instance generator is programmed in Python, by which we generate random graphs and layout them in two-dimensional space. After graph generation and calculation of SNA KPIs (e.g. betweenness centrality) the data is exported to AnyLogic. In AnyLogic we deploy a Susceptible-Infected-Recovered (SIR)-model from epidemiology literature to mimic the disruption propagation of the ripple effect throughout the network. Initially, all nodes in the supply chain network are in susceptible state. By initially infecting one (or multiple) nodes, the propagation process is started and the “infection” spreads naturally throughout the network. Infected nodes recover after a certain time and thereby gain immunity against further infections.
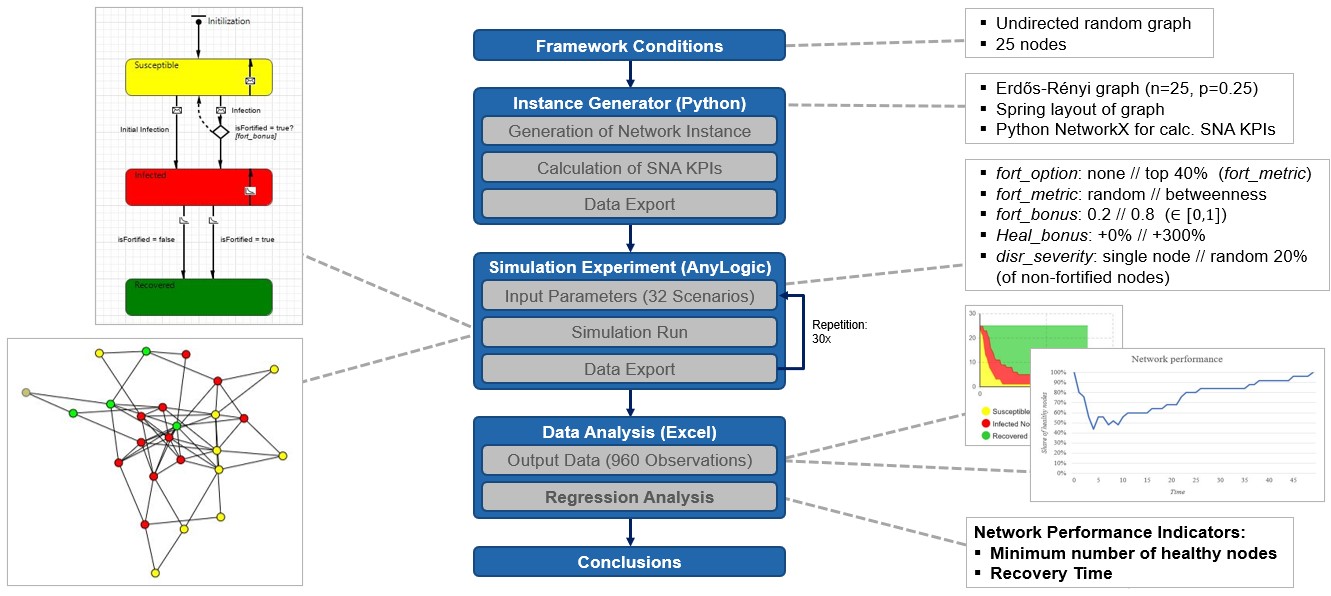
For our simulation experiment we alternate the values of five parameters, thus creating 25 = 32 different scenarios, which are each run 30 times with a random seed. Consequently, we obtain 32 * 30 = 960 observations. This data is exported to Excel where we perform two regression analyses to quantify the impact of our parameter variation on network performance, measured by two different network performance indicators:
1) Healthy Nodes, representing how deep the dip in network performance is.
2) Recovery Time, representing the time duration until the network performance is back on its initial level.
Looking at the regression output tables we can draw the following conclusions:
With Healthy Nodes as dependent variable, we may explain quite a bit of its variation by the independent variables. We find that the interaction term fort_option * fort_metric is statistically significant at the 1% level and has a positive sign, meaning that if we fortify nodes at all, then selection of nodes based on betweenness centrality results in a better network performance compared to randomly fortifying nodes, making betweenness centrality a suitable node selection logic for supply chain managers to mitigate the ripple effect.
When we set Recovery Time as dependent variable, we find only low explanatory power in our regression model. We observe contradictory and implausible results. Obviously, mechanisms impacting Recovery Time are not well understood and most likely not adequately captured by the model.

Future research will focus on overcoming the limitations of our model:
- Experiments were performed on the same, single graph. We plan to repeat experiments on other, different graphs with the same properties to validate our results.
- Further, we plan to repeat experiments on graphs varying in size and structure, moving from random graphs towards small world and scale-free networks.
- Next, we plan to explore the effectiveness of utilizing other SNA KPIs as selection criterion, such as node degree, degree centrality, closeness centrality or page rank.
- Obviously, a deep dive on mechanisms affecting Recovery Time is required.
First results have already been presented at EurOMA. In a next step, simulation experiments will be extended as has been described above.