If you stepped outside last week, you didn’t need a thermometer to tell you that summer had arrived. At the end of June, Switzerland experienced a historic heatwave, with over 40 meteorological stations across the country recording new temperature records for the month. Maximum daytime temperatures exceeded 38°C at several locations, and many regions experienced tropical nights, where minimum temperatures remained above 20°C.
The primary cause of this event was a stable high-pressure system that transported hot, dry air masses from North Africa across Central Europe. Combined with the high solar radiation and long daylight hours characteristic of late June, this led to sustained high thermal load.
We experienced this thermal load firsthand in our own office in Winterthur. Fortunately, through an ongoing collaboration with the city of Winterthur, we have access to the local temperature measurement network, which allows us to look closely at what our sensors recorded during this heatwave. If you are interested in the data, the historical records are publicly available on the Stadt Winterthur open data portal, and you can also view the live, real-time temperatures right now on the Winterthur city temperature network map (under the tab «Stadtklima»).
So what did we measure in WInterthur? Let’s have a look:
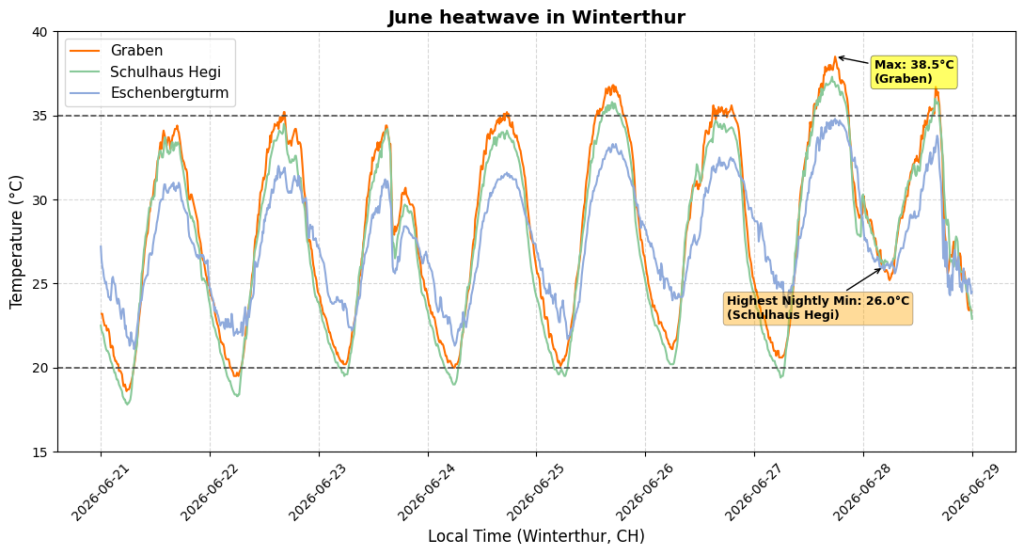
The figure shows the temperature measurements, recorded every 10 minutes between June 21st at 00:00 and June 28th at 23:59, for three different stations within the Winterthur city network. The orange line represents the Graben station, located directly in the city center in an environment dominated by concrete and asphalt. The green line shows the Schulhaus Hegi station, situated in a residential neighborhood with a higher proportion of green spaces. The blue line represents our remote station at the top of the Eschenberg tower; positioned above a forested hill at the highest point in the area, this station measures open-air temperatures that are less affected by ground-level heating and cooling. For reference, dashed lines are included at 20°C and 35°C.
Several non-surprising observations can be made from this plot:
- The plot presents typical temperature patterns during a heatwave, showing daily maximum temperatures consistently reaching or exceeding 35°C, and nighttime minimums hovering around or above 20°C. This confirms both the extraordinary daytime heat and the occurrence of tropical nights across the city.
- The highest temperature in the dataset was recorded at the Graben station on June 27th, peaking at 38.5°C. However, it is important to note that this value represents an isolated 10-minute peak. Furthermore, because this sensor is mounted on a large traffic pole in the middle of a major road junction, it experiences highly localized microclimatic heating and does not fully represent the overall temperature of the city center.
- For nearly the entire period, the Graben station registered slightly higher or equal temperatures compared to Schulhaus Hegi, both during the day and at night. This difference is expected, as the dense city center typically stays 1–2°C warmer than residential areas due to a higher proportion of sealed surfaces and less vegetation.
If we look past the expected patterns, the plot reveals two much more interesting observations that are worth breaking down:
- During the day, the Eschenberg tower station consistently records the lowest temperatures, often up to 4°C cooler than the Graben station. This is expected due to its higher elevation and the cooling effects of vegetative evapotranspiration from the surrounding forest. At night, however, the pattern reverses: the tower recorded temperatures up to 4°C higher than Schulhaus Hegi. This occurs because stable atmospheric inversions frequently develop on summer nights due to radiative cooling. After sunset, the ground cools down and lowers the temperature of the air layer directly above it. Because this cool air is dense and heavy, it stays near the surface and prevents vertical mixing, leaving a layer of warmer air at higher elevations.
- A notable exception to this pattern occurred during the night of June 27th and the early morning of June 28th, when temperatures at all stations remained above 25°C. Data from the OSTLUFT network shows that this was also observed at other regional stations, such as Zürich and Kloten, indicating a (at minimum) regional phenomenon. Notably, the typical nighttime inversion disappeared entirely, with all stations measuring nearly identical temperatures. This indicates a well-mixed, homogeneous air mass where no vertical stratification occurred. The lack of cooling and mixing could be attributed to stronger surface winds preventing the inversion from forming, or increased cloud cover trapping thermal radiation. The exact atmospheric drivers behind this exceptionally warm night require further investigation.
This late June heatwave provided an exceptional start to the season, demonstrating how intense early-summer thermal loads can be at both a regional and local level. It remains to be seen what the rest of the summer will bring in terms of extreme weather events.
In the meantime, our high-resolution urban network will continue tracking these microclimates. We highly encourace you to visit the Winterthur city temperature network map, and have a look at the current temperatures every now and then (just open the tab “Stadtklima”). And if you want to do some of your own research, get the data from the open data portal and start digging!