Navigation menu
- Education
- Emissions & Air Quality
- Infrastructure & Services
- Meteorology & Climate
- News
- Physical Chemistry
- Projects
- The Team
In spring three years ago, in the middle of the first lockdown of the Covid-19 pandemic in Switzerland, we packed up our measurement system (SMARTEMIS) and drove to Zurich Airport to record unique air quality data near the airport area. At this time, aircraft movements had dropped by more than 90% compared to the previous year and we hoped to record the background concentration of air pollutants in the vicinity of the airport. Of course, one must always take into account that other emission sources were also significantly reduced during this time (e.g., motorised private transport).
At that time, we thought that we would be able to repeat the measurements a year later, when the flight movements would have recovered to normal levels. How wrong we were! Now, three years later, the aircraft movements at Zurich Airport were again at about 90% compared to 20191. So, we decided to repeat the measurements in spring 2023 to be able to compare the data of the two measurement campaigns.
For the measurements this spring, we were able to get access to a nearby power supply. We would like to express our gratitude once again to the “Tiefbauamt” of Canton Zurich for the straightforward access to the power connection of the road wastewater treatment plant in Kloten. In spring 2020, we had to rely on a gasoline-powered electrical generator, which, depending on the wind direction, slightly affected our measurements.
Data acquisition
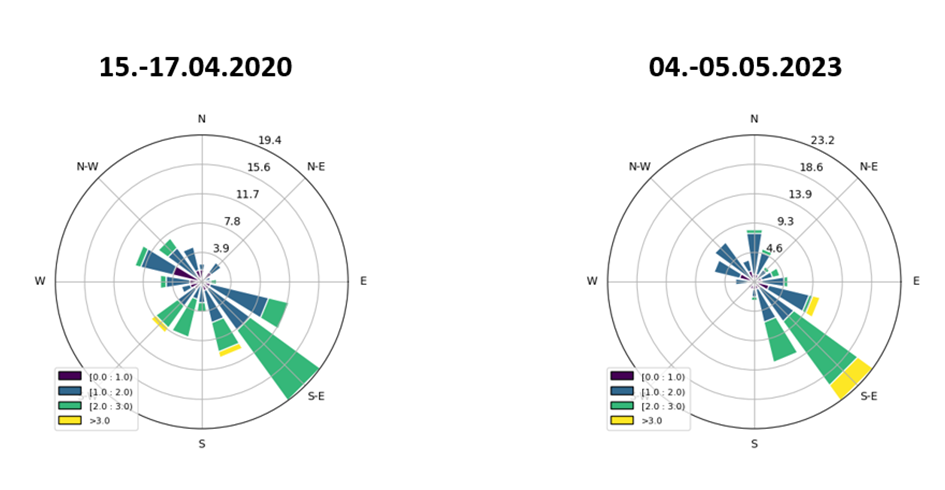
As we wanted to minimize the external factors that always influence such measurements, we made sure that both the phenological conditions and the weather situation corresponded as closely as possible to those that prevailed during the measurements in the year 2020. This was not an easy task, but just before we gave up hope, the desired weather conditions set in at the beginning of May. Nature was already slightly ahead compared to 2020, but the wind conditions were very similar to 2020 (Fig. 1). The temperatures also remained within a similar range, with daytime highs around 23°C.
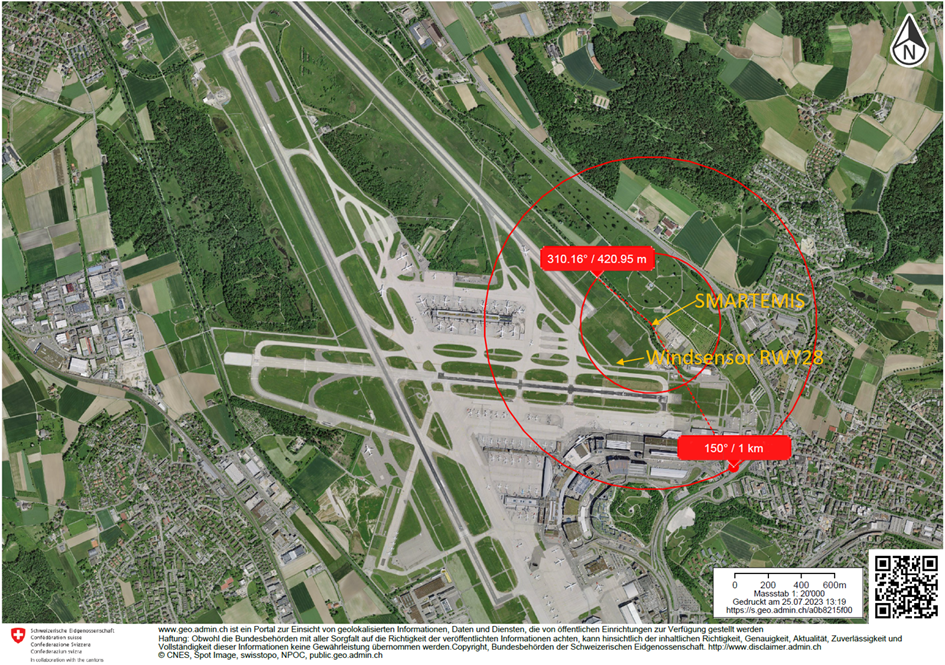
So, we loaded the measurement system onto a transporter and drove to the same location as in 2020. The distance to runways 28 and 32 in the south and west, as well as to the highway in the north and east of the measurement site, was each slightly over 400 meters (Fig. 2). Upon arrival, we set up the measurement system and measured the composition of air pollutants for a little more than 24 hours. Due to an approaching thunderstorm on May 5, 2023, we had to stop the measurements slightly earlier than planned.
In comparison to 2020, we installed an improved wind measurement station and additionally added two Partector 2 units (one right after the air intake, running parallel to the gas analyzers) and one running parallel to the SMPS in the PM rack. The air intake was situated approximately 5 meters above the ground and was equipped with a 2.5-micrometer cyclone to remove larger particles.
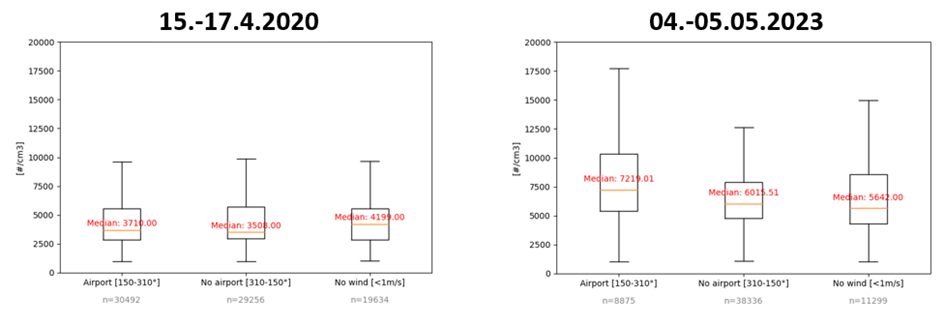
The following results pertain solely to the particulate matter (PM) pollution. The gaseous pollutants show no significant changes, although they have not been examined in detail yet. For the analysis, pollutants are divided based on wind direction. Air coming from 150 to 310 degrees corresponds to the airport and is labelled as “Airport”. Otherwise, it’s labelled as “No airport,” except when wind speeds fall below 1 m/s, which is referred to as “No wind”. Unfortunately, the wind measurement data from the first measurement campaign were unusable (recorded only every 15 minutes and corrupted due to the wind measurement devices being mounted directly on the roof of the transporter instead of on a higher pole).
Fortunately, there is a wind measurement station operated by MeteoSwiss (MeteoSchweiz Flugwetter-Windsensor RWY28) located approximately 300 meters away on the airport premises (Fig. 2, “Windsensor RWY28”). The data from this station closely aligns with our own wind measurement data from the 2023 campaign, which is why, for further analysis, only the wind measurement data from the wind sensor between runways 28 and 32 were utilized. In addition, we used only the measurement values between 6am and 12pm for the analysis, as this approximately corresponds to the operating hours of the airport.
Results
The non-volatile particulate matter (nvPM) number concentration in 2023 was significantly higher compared to the measurements taken in 2020. While the particle number concentration from air masses coming from the airport nearly doubled (+95%), the number concentration also increased for “No airport” (+71%) and calm wind conditions (+34%). It should be noted that the background concentration (10th percentile) for 2023 was more than 30% higher than in 2020.
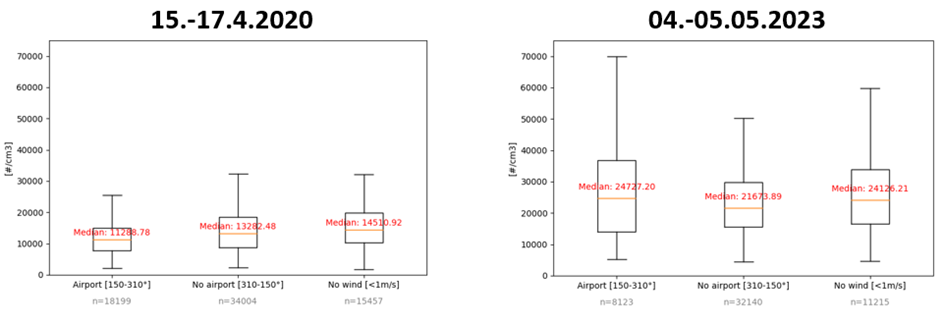
The total PM number concentrations show similar results. For air masses coming from the airport, the values have more than doubled (+119%) in 2023, while for “No airport” and “No wind” the values increased by 63% and 66%, respectively.
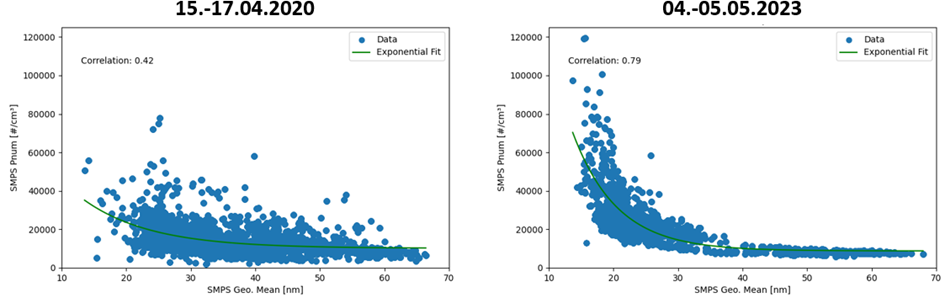
Larger differences emerge when examining the particle size distribution. In the 2020 measurements, the median particle size was 31.9 nm, whereas in 2023, it decreased to 21.5 nm. During the night (12 am to 6 am), the values were very similar, specifically 46.7 nm in 2020 and 48.5 nm in 2023. Moreover, the correlation between particle number and particle size in 2023 is significantly higher at 0.79 compared to three years earlier (0.42). High concentration of very small particles (nvPM and vPM) is associated with aircraft engine operations (e.g., Kinsey et al. 2010).
This is significant because the size of particles determines how and where they deposit in our bodies. One metric that considers this and is therefore an indicator of the health impact of PM concentrations is the so-called LDSA (Lung Deposited Surface Area) (e.g. Schmid and Stoeger, 2016). Therefore, we have also calculated the LDSA values for both measurement campaigns. While the values for air masses not coming from the airport or for calm wind conditions have increased moderately (23% and 38%, respectively), the values for air coming from the airport have more than doubled (+105%) compared to 2020.
Even though the measurement periods of the two field campaigns were relatively short, and the wind data from a location about 300 meters away from our measurement site may not perfectly reflect the wind conditions, the results are highly plausible and intriguing. They confirm the magnitude of fine particulate matter pollution around the airport as reported in other publications2,3 and suggest that the airport has a greater impact on both particle number concentrations and especially LDSA compared to the nearby highway. However, this should by no means be generalized; it is only valid for the measurement location.
- https://media.flughafen-zuerich.ch/-/jssmedia/airport/portal/dokumente/das-unternehmen/politics-and-responsibility/noise-and-sound-insulation/monatliche-flugbewegungen_2306.pdf?vs=1&rev=e1e7836603d648869422f7c06fcfba16&_gl=1*18va5ee*_ga*MTg3MjMzMzQ4Mi4xNjkyMDg5NzAz*_ga_DSZCF55S8K*MTY5MjM0NTU4Mi4zLjAuMTY5MjM0NTU4Mi4wLjAuMA..&_ga=2.148224567.1452101056.1692345583-1872333482.1692089703 ↩︎
- https://media.flughafen-zuerich.ch/-/jssmedia/airport/portal/dokumente/das-unternehmen/politics-and-responsibility/environmental-protection/technische-berichte/2022-01_zrh_nv-v-ufp-study.pdf?vs=1&rev=ea9ddf362e894291be5df69489b0eec1 ↩︎
- https://nanoparticles.ch/archive/2021_Sintermann_PR.pdf ↩︎