Navigation menu
- Education
- Emissions & Air Quality
- Infrastructure & Services
- Meteorology & Climate
- News
- Physical Chemistry
- Projects
- The Team
The International Civil Aviation Organization (ICAO) requires that engines of maximum rated thrust greater than 26.7kN be certified for their emission performance[1]. For certification, ICAO defined four power modes in an aircraft’s landing-take-off (LTO) cycle as emission test points. These modes include idle/taxi at 7% of the maximum rated thrust (Foo), approach at 30% Foo, climb-out at 85% Foo, and take-off at 100% Foo. Engine manufacturers shall report their certification data, which are collated in an engine emission data bank (EEDB) managed by the European Union Aviation Safety Agency (EASA)[2],[3]. Several airport air quality models are based on the emission data present in the EEDB.
In addition to emissions from ground support vehicles at airports, the idle/taxi power mode is important for air quality and exposure of ground support staff to hazardous air pollutants. As a result, research efforts have worked on assessing the real emissions on ground[4],[5]. While the EEDB data reports idle/taxi at 7% Foo, the actual thrusts applied at idle/taxi is not always 7%, which may impact emissions. Airport surveys have shown that actual idle/taxi thrust varies between 3% and 10% depending on the engine type, the number of engines in operation, and the type of maneuver the aircraft is undertaking (up to 10% for 90° turns)[6],[7],[8],[9]. And, the APEX measurements revealed up to twice as much/less emissions at lower thrust settings compared to 7% Foo[4]. Unfortunately, the time spent in thrusts below 7% Foo is largely unknown, impacting the level of certainty of results from airport air quality models7,8.
We performed preliminary assessment of low power emissions data collected alongside maintenance tests at SR Technics, Zurich using SMARTEMIS from 2013 to 2022. SMARTEMIS is one of three reference measurement systems for engine certifications in the world and operated by ZHAW. Measurements were conducted on in-service engines returned for maintenance after the maintenance work had been done. Low power here refers to thrusts between 2% and 15% Foo. We corrected the emission indices (EI) to ICAO standard atmosphere at sea level (ISA): 15 °C, 1013.25 hPa.
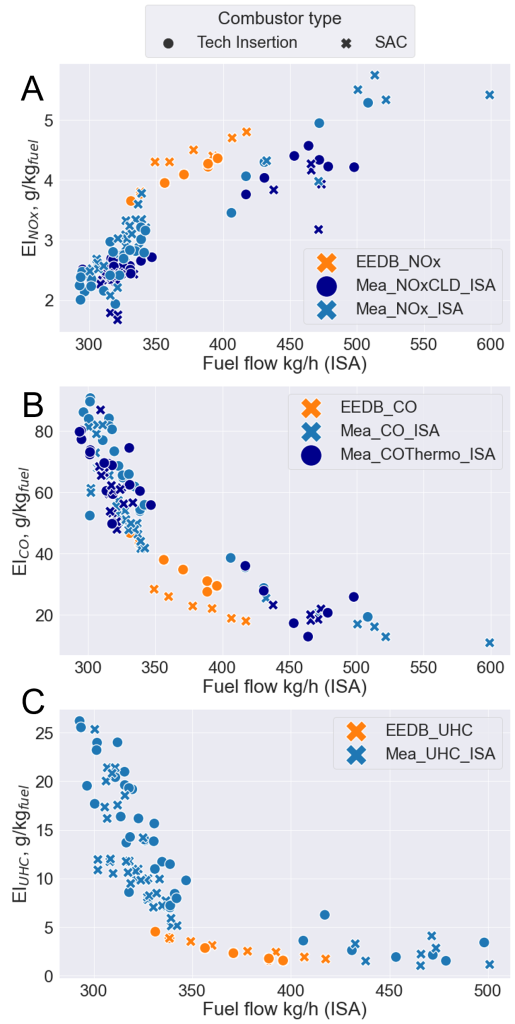
Here, we focus on a subset of engines tested (emission indices (EI) presented as a function of fuel flow corrected to ISA) in Figure 1. EI of nitrogen oxides (NOx, EINox) varies linearly with fuel flow (Figure 1A). For the same fuel flow, measured EINox is lower than that presented in the EEDB for corresponding combustor (Figure 1A). The inverse is the case for carbon monoxide (CO, Figure 1B) and unburned hydrocarbons (UHC, Figure 1C). With CO and UHC, measured EIs are similar (CO for tech insertion engines) or higher than those reported in the EEDB for the same fuel flow. At lower fuel flow (for thrusts lower than 7% Foo), EICO and EIUHC are significantly higher than EIs at the ICAO idle/taxi power.
These observations are similar to those of the APEX measurement series[4], reiterating the concerns of higher exposure than airport air quality models may predict using EEDB data alone for CO and UHC. At lower fuel flows, the EEDB based models may overestimate NOx emissions.
[1] ICAO, ICAO Annex 16 International standards and recommended practices – Environmental Protection. Volume II – Aircraft Engine Emissions 4th Edition, 2017.
[2] ICAO, “ICAO Engine Exhaust Emissions Data bank”, can be found under https://www.easa.europa.eu/domains/environment/icao-aircraft-engine-emissions-databank, 2020.
[3] Switzerland and a few other non-EU countries are also members of EASA.
[4] Changlie Wey, Chowen C. Wey, Gaseous emissions acquired during the Aircraft Particle Emission Experiment (APEX) series, 2007.
[5] H. R. Jonsdottir, M. Delaval, Z. Leni, A. Keller, B. T. Brem, F. Siegerist, D. Schönenberger, L. Durdina, M. Elser, H. Burtscher et al., Communications biology, DOI 10.1038/s42003-019-0332-7.
[6] Kevin M. Morris, PSDH_Technical_Reports_BA, 2006.
[7] G. Schürmann, K. Schäfer, C. Jahn, H. Hoffmann, M. Bauerfeind, E. Fleuti, B. Rappenglück, Atmospheric Environment, DOI 10.1016/j.atmosenv.2006.07.030.
[8] Airport Cooperative Research Program, Transportation Research Board, National Academies of Sciences, Engineering, and Medicine, DOI 10.17226/14168.
[9] O. Zaporozhets, K. Synylo, IJSA, DOI 10.1504/IJSA.2017.10005971.