Navigation menu
- Education
- Emissions & Air Quality
- Infrastructure & Services
- Meteorology & Climate
- News
- Physical Chemistry
- Projects
- The Team
Cities globally seek to improve the quality of living and consequently pay great attention to the effects of new constructions on the surrounding. Furthermore, there is a great demand for evaluating methods to mitigate the urban heat island effect. Exemplarily, the city of Zurich mapped out strategies on how to approach the urban heat problem (Fachplanung Hitzeminderung). However, the number of field experiments remains quite limited. Construction sites therefore offer an interesting glimpse into the changing urban climate in the absence of designed experiments. ZHAW/Metenvia operates a dense temperature network in Zurich (see Blogposts, Measurement network, Tropical nights in ZH, Measuring air temperature correctly) and also scientifically supports heat island mitigation measures like the artificial cloud “Alto Zürrus” (One ring to cool them all) and modelling studies (Simulating urban climate in ZH, Simulating urban cold air streams).
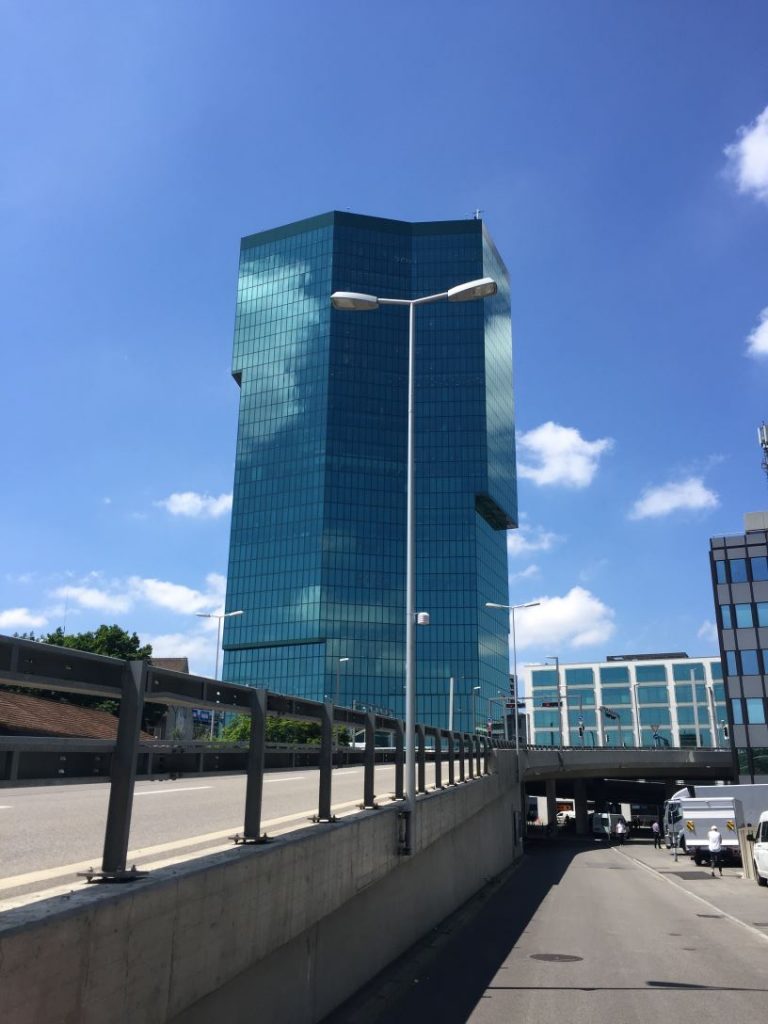
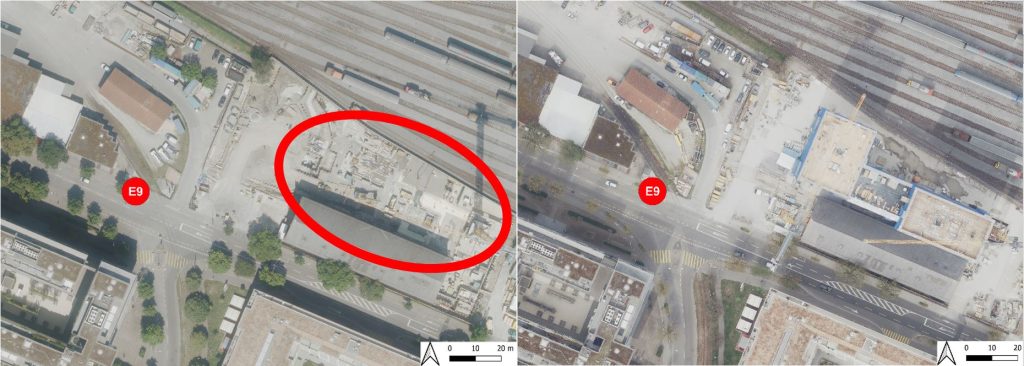
In this blog post, we investigate if and what we can learn from changes near measurement stations that were not specifically monitored. One such event occurred close to the measurement station ‘E9’ on Hohlstrasse, where a building was demolished in 2019 and a new building was constructed in 2021 (Figure 1). From the micro-meteorological perspective, the period 2020 and 2021 are therefore different. The empty construction plot in 2020 may have opened up ‘E9’ to air circulation or may have had an impact on the radiation and shading patterns.
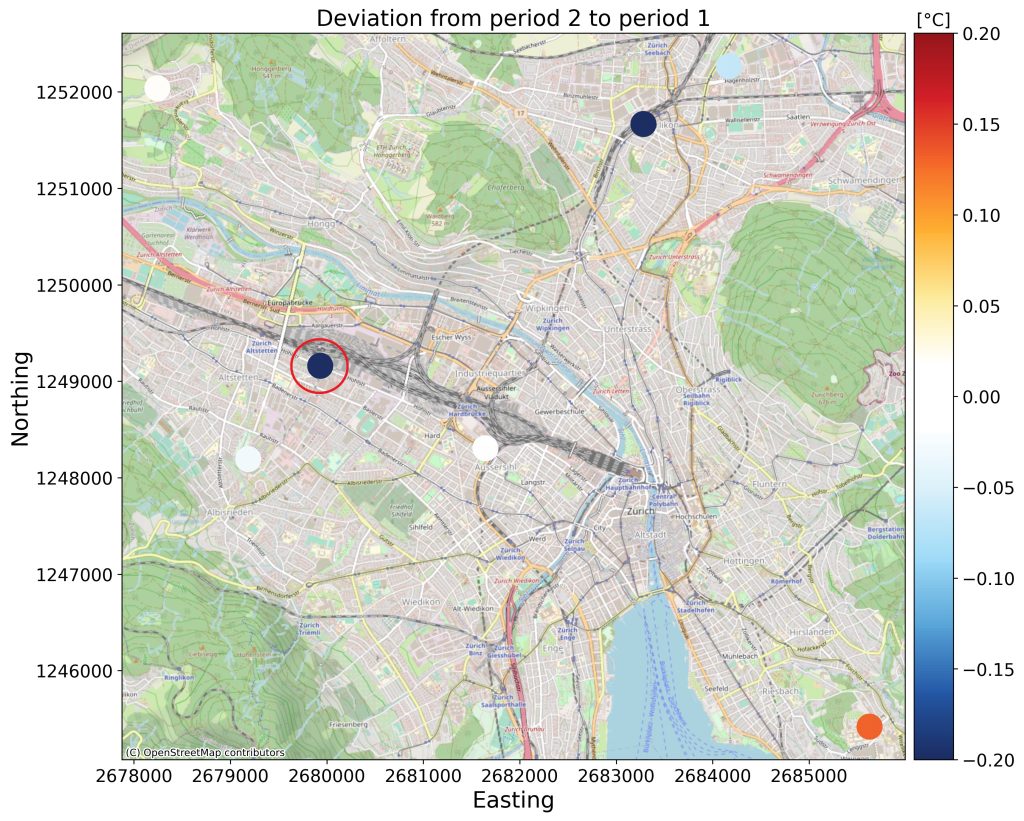
There were a number of other significant construction projects going on very close to other stations as well (Figure 2). By subtracting the mean over the neighbouring stations from the measured signal, it is possible to eliminate much of the natural variability due to weather and climate in the temperature signal (Figure 3). This makes a comparison between two time periods (1: 11.2019-10.2020, 2: 11.2020-10.2021) easier. Figure 2 shows the difference between period 2 and 1 for seven construction sites. Two stations show a decrease and one station shows an increase in temperature, whereas the others remain virtually unchanged.
In Figure 3, we can see how the measured temperature at ‘E9’ deviates from its neighbours during the two years. It appears that ‘E9’ is generally a bit colder in winter and a bit warmer in spring and summer than its surrounding. It is also clear that ‘E9’ was on average slightly warmer in the first year, whereas in the second year, it is clearly colder than the surrounding stations. This drop of 0.3°C is likely caused by local changes.
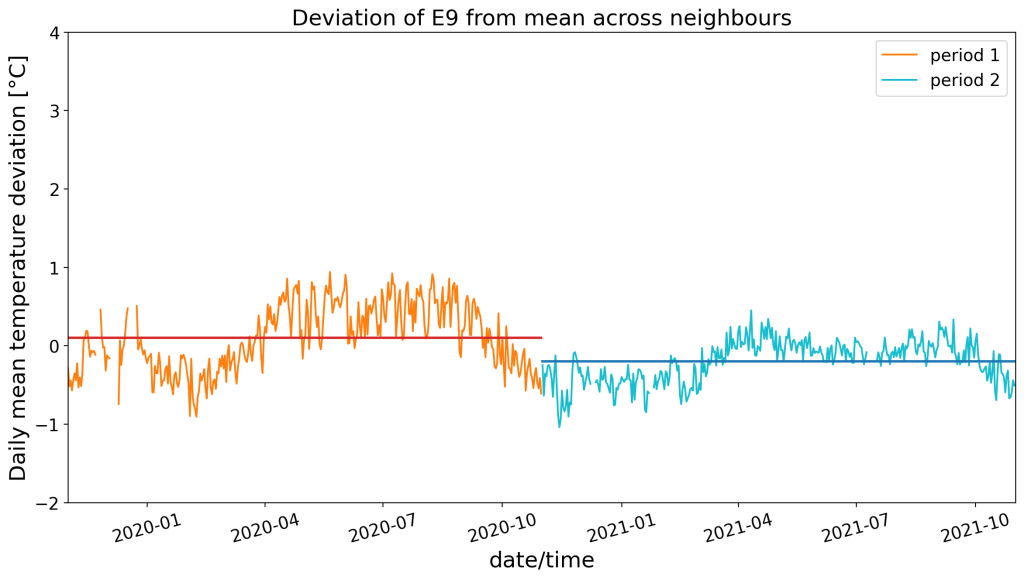
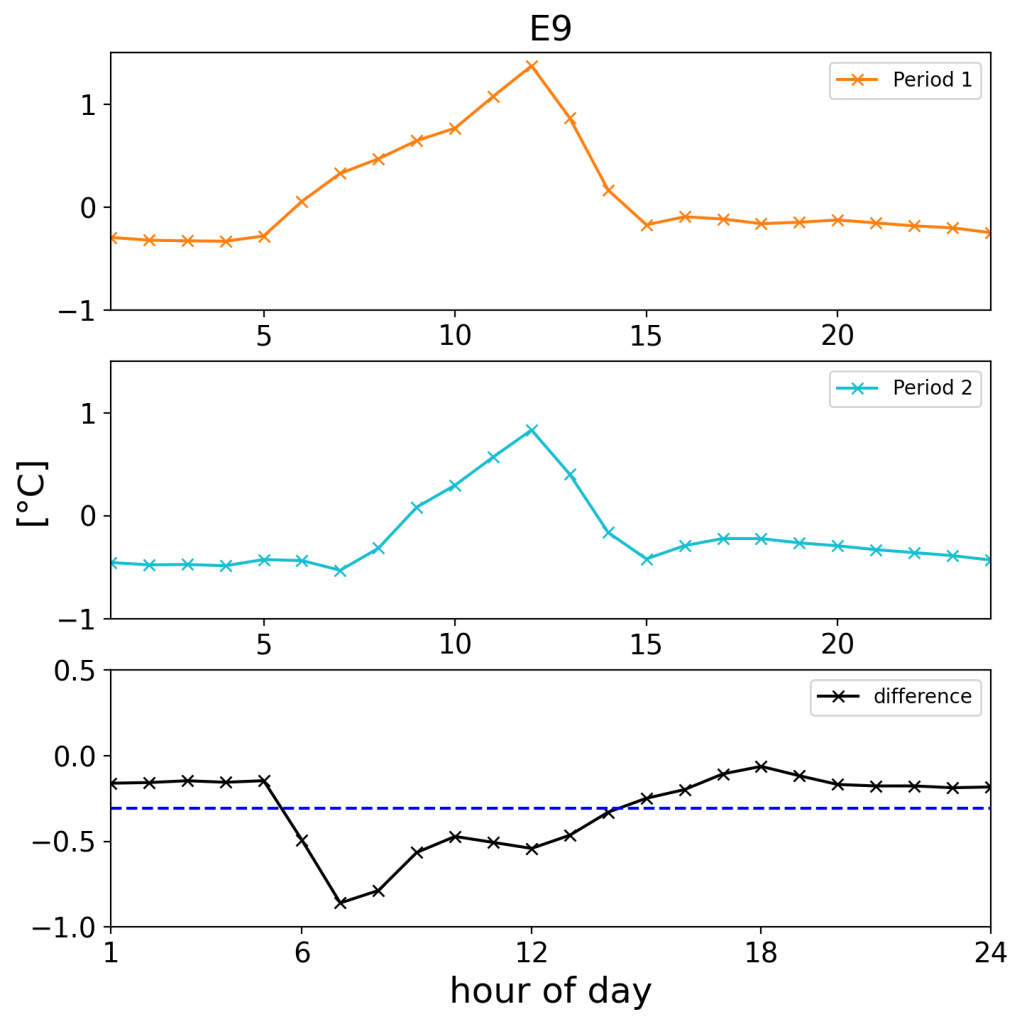
Figure 4 shows the daily cycles of those temperature deviations. ‘E9’ is slightly colder at night and hotter during the early afternoon. In the second year, the mornings especially get colder, whereas the rest of the day remains relatively unimpressed. One explanation could be that the new building leads to shading in the morning, when the sun rises in the east. Over the day, this effect drops off. However, there could always be other or more factors at play.
While monitoring the urban climate, we at ZHAW/Metenvia remain interested in those insights into the urban environment that a dense temperature network allows; even in the absence of designed experiments.