Navigation menu
- Education
- Emissions & Air Quality
- Infrastructure & Services
- Meteorology & Climate
- News
- Physical Chemistry
- Projects
- The Team
Our group had the pleasure to host this years Symposium of the Swiss Society for Meteorology (SGM).
Within four sessions, the participants could listen to 11 highly interesting contributions from emeriti, scientists, engineers, meteorologists, and entrepreneurs within the field of historic to modern measurements, and from established to new remote and in-situ measurement techniques.
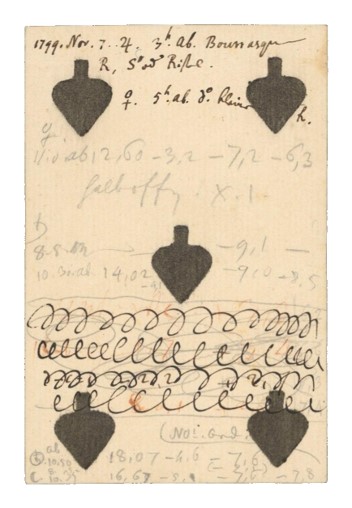
Dr. Yuri Brugnara started the day with a fascinating overview of early weather observations in Switzerland. We learned that Johann Jakob Scheuchzer (1672-1733) was one of the first regular observers in Switzerland, especially motivated to investigate the relation between weather and illness. Over time, more and more weather observers contributed to an impressive wealth of data (ca. 10 million measurements priod to 1864), of which about a third has already been digitalized. A task often underestimated, as much of the data needs to be entered by hand into data sheets: Weather observations noted on relatively “creative” sheets of papers can not be scanned and interpreted by computers – even nowadays with the help of AI.
Yuri showed that the recorded datasets are very useful and of decent quality, allowing the analysis of long-term temperature variability since the 1750s. This, for instance, allowed for the analysis of cold spells in the 1720s using data assimilation techniques.
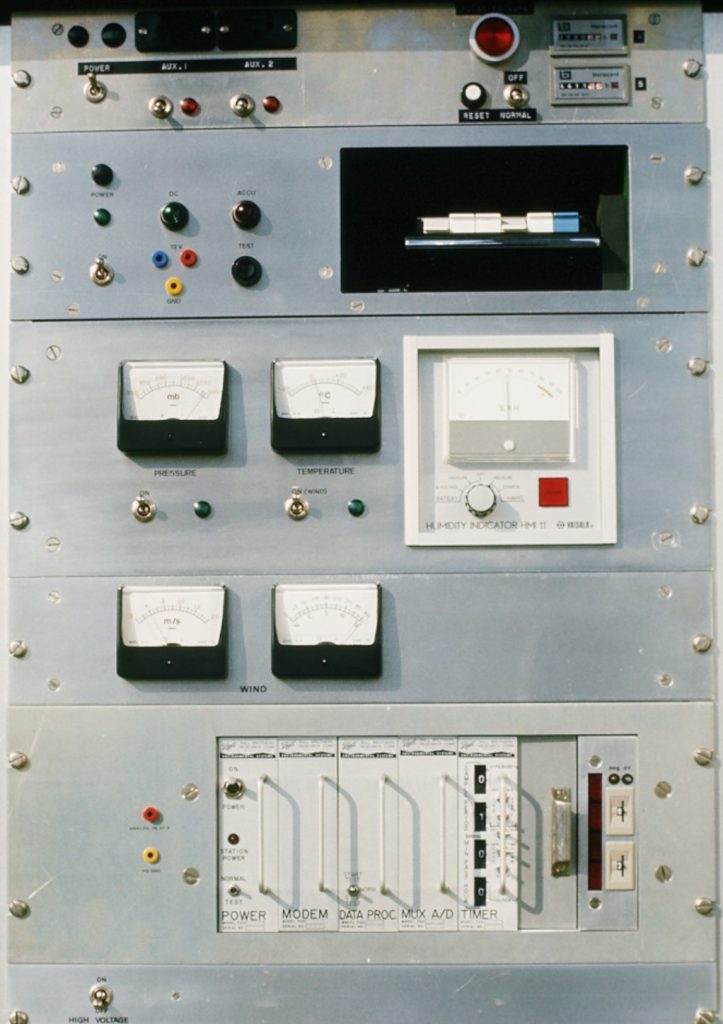
Subsequently, Dr. Werner Nater gave us a fantastic look back into atmospheric research field campaigns of the late 70s-80s. Werner took us into the exciting world of boundary layer meteorology during Föhn events – at a time, when automatic real-time measurements where still a novum and data recording was done using innovative solutions. For instance, the “Merenschwand” weather station he designed & used during his PhD studies used a conventional cassette recorder for tone-modulated recording of the different meteorological values. With the help of a SODAR, Werner was able to detect a clear correlation between wave activity at the upper boundary layer and surface pressure variations in the order of a few tenths of mb. Later studies acknowledged that these small short-term pressure fluctuation can cause discomfort for people with weather sensitivity.
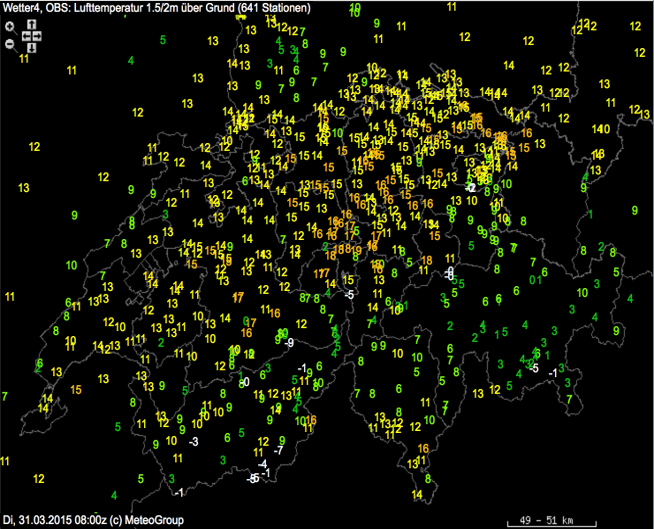
The last input of the first section was done by Joachim Schug, senior meteorologist at DTN. Joachim explained why and how the Meteocentrale (later MeteoGroup / DTN) private weather station network was designed. The original motivation was to provide a better warning service to the general public. In 2006, the ca. 80 existing weather stations did not provide enough geographical granularity to allow the development of a robust small-scale weather alarm service. Hence, between 2007 to 2009, Meteocentrale installed 199 semi-professional & professional (Thies, Lambrecht, Davis, Lufft) weather stations. Using Model Output Statistics, the station network made it possible to provide a weather hazard warning service for 150 regions in Switzerland. Nowadays, combining the weather stations of MeteoSwiss and DTN/MeteoGroup, over 540 stations are reporting 10-minutes data of the most essential meteorological variables.
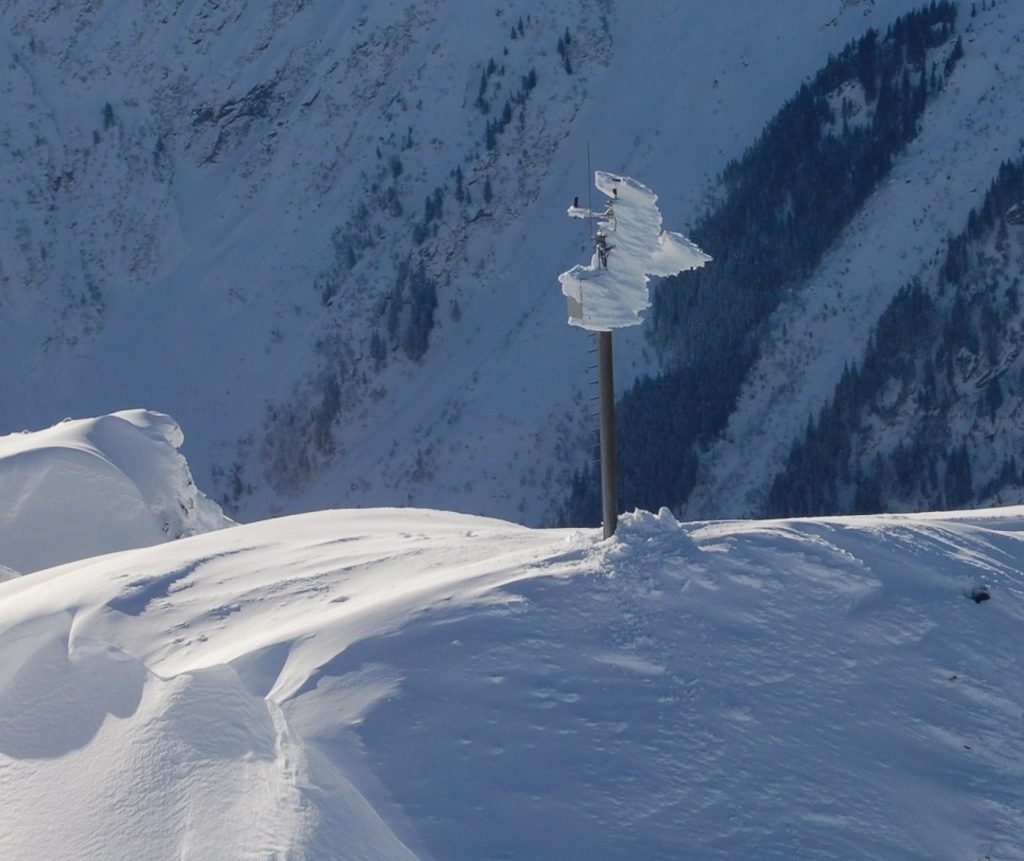
The second session adressed the acquisition of weather data in a challenging enviroment. David Liechti, system specialist at the WSL Institute for Snow and Avalanche Research SLF, showed in which extreme conditions the intercantonal measurement and information system “IMIS” has to be operated. The IMIS network encounts 186 self-sufficient stations measuring a combination of wind, air, soil and snow surface temperature, humidity, precipitation, radiation and snow height and was designed primarily to improve avalanche forecasts. All the data is fed into the SNOWPACK model, an important tool allowing to keep an overview of the snow pack structure over the entire winter season, thus making it possible to provide daily avalanche bulletins.
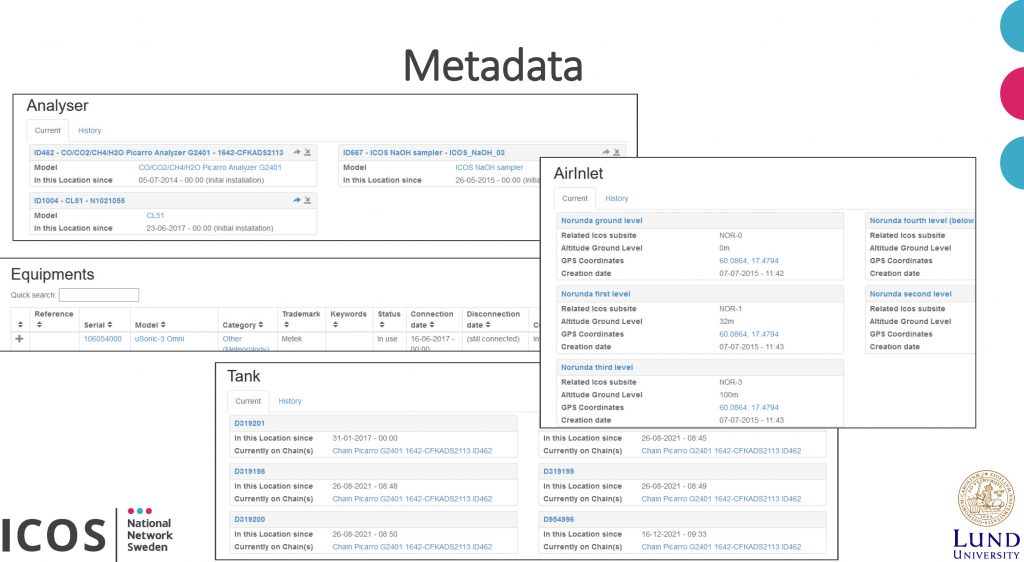
Dr. Irene Lehner, research engineer at the ICOS Norunda field station reminded us how important it is to first know what, why, where and how a meteorological quantity needs to be measured before a field campaign is started. The reason is simple: No measurement is perfect, and even after installing “a perfect sensor”, site errors may influence the recorded time series. Each measurement is therefore the result of a perfect compromise.
Before buying an expensive instrument, Irene often reminds junior scientists to think about the precision and accuracy, as well as temporal resolution required to answer their research question. The budget, the available infrastructure and personnel as well as site settings will further limit the choice of sensors. The result of this preliminary assessment then often defines 1-2 sensors which come into consideration.
Irene then also gave us an overview of the standard operating procedures concerning quality control / quality assurance tasks at Norunda, as well as the long-term documentation technique of sensor metadata.
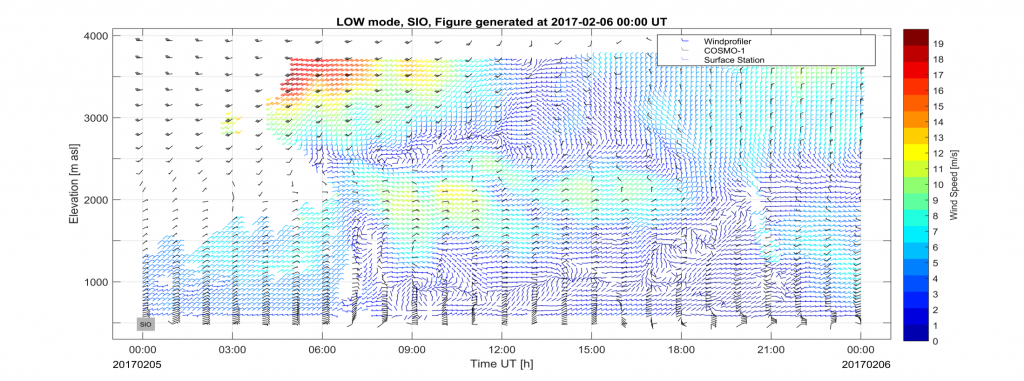
The afternoon started with a very nice overview of the remote sensing facilities operated at MeteoSwiss. Dr. Maxime Hervo revealed the EMER-Met measurement/forecasting concept to the audience, which was expecially designed as an early warning system in case of nuclear incidents at one of the (formerly four) three nucelar power plants in Switzerland. The EMER-Met network is equipped with 3 fixed (& 1 mobile) wind profilers (SODAR/LIDAR/Microwave Radiometer). In conjunction with the data of 3 high tower stations, the assimilized data is used as initial conditions for the Swiss COSMO-1E forecasting model, which then allows the calculation of plume dynamics with the Flexpart model.
Maxime also demonstrated the scientific use of the wind profiler and showed impressive comparisons of wind profiler data with COSMO-1 model results within a complex mountain valley environment.
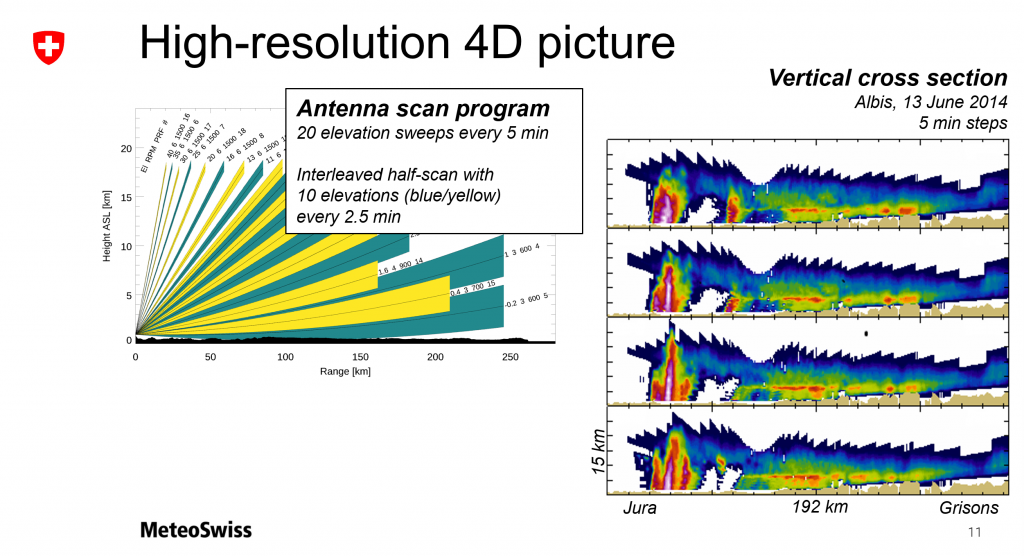
Dr. Urs Germann elegantly moved on to the second remote sensing talk of the afternoon and showed us the impressive progress which was done in radar meteorology over the last 60 years in Switzerland. From the first generation of X-band radar installed in 1959 to the current, fourth generation dual-polarization doppler C-band radar, the 3D-representation of precipitation and therefore the warning products became better at every new generation of the radar network. Nowadays, the Swiss “Rad4Alp” network provides a full scan every 5 minutes, and a half-scan every 2.5 minutes. In rapidly evolving thunderstorm cells, such a high refresh rate can save lifes: A good example is the “nowcast” of river runoff for a certain catchment area based on radar echo, were evacuation during construction works is essential to avoid any casualties.
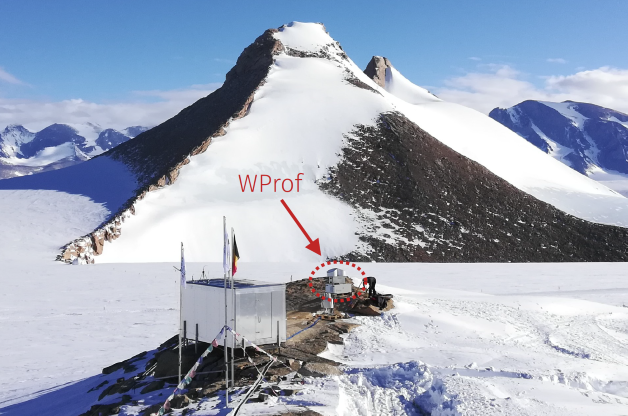
Dr. Alfonso Ferrone gave us an impressive insight into his field campaign in Antarctica performed during his PhD. With all-year-round negative temperatures and windy conditions, in-situ precipitation measurement is extremely challenging. Hence, Alfonso deployed a series of doppler radars allowing the investigation of precipitation formation mechanisms (including cloud microphysics) and the influence of the Antarctic topography on precipitation intensity. Interestingly, his radar network allowed to discern signatures of precipitation sublimation below Ac virga clouds; A result agreeing well with numerical modelling simulations performed with WRF.
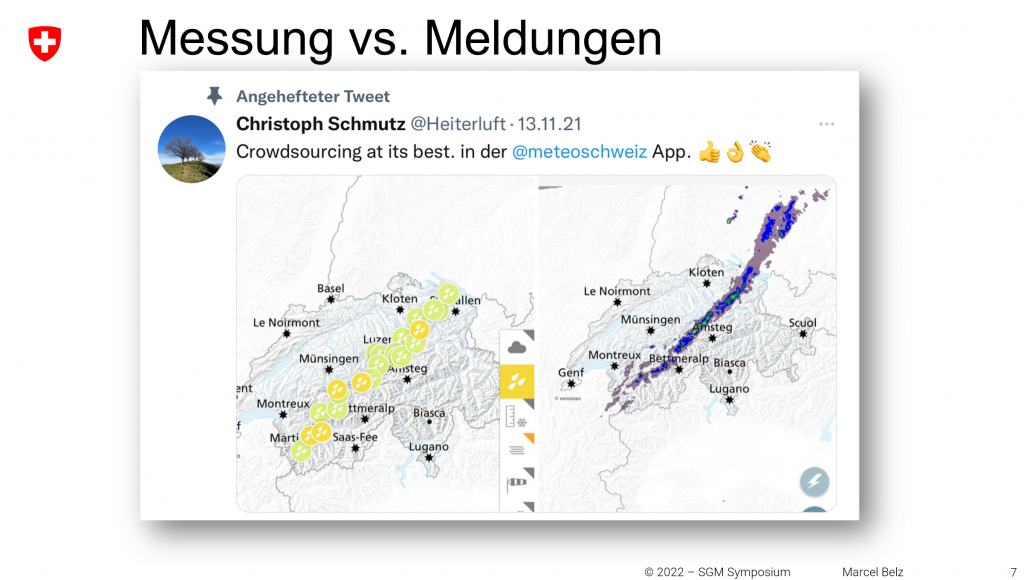
The last session was reserved for new, innovative weather observation and measurement techniques, and was initiated by an input from Marcel Belz, product manager at MeteoSwiss. Marcel described the “birth” of the MeteoSwiss app – an app used by up to 1.8 million users per day, and which won 2 design prizes. Since the third version of the app, users can now report the current weather and document it with an image. Since these images – after an automatic quality filter scheme – can be used by on-duty weather forecasters, Marcel stressed the importance to add an image to every reported weather condition. Beneath the use of the images within the MeteoSwiss blogs, the images may have further usages in e.g. scientific projects related to AI cloud classification/weather classification products.
As a sneak peek, Marcel mentioned that v4.0 of the App (to be published next year) will, among other small updates, probably allow a “social media”-like timeline function for the users.
In the next input, Mario Betschart from inNET Monitoring AG showed us the rocky road of development for a new type of in-situ hail intensity (including size) sensor. During the thunderstorm season, certain regions of Switzerland, especially along the so-called “Voralpenschiene” (Château d’Oex – Gantrisch – Napf – Alpstein), are overproportionally exposed to hailstorms, causing very high financial damages to buildings, cars or agriculture. Already used in the 1970s, “hailpads” made it possible to detect the intensity of hailstormsm which – in combination with radar measurements – allowed to learn more about hailstorm dynamics.
With the vision to to improve ultra-short time hail forecast, to verify radar algorithms and to finally reduce hail-induced damages, inNET designed the new measurement device “HailSens”. HailSens works following an acoustic principle, and allows to calculate the size of each hailstone impacting the sensor surface. The project was very successful and ended up into an automatic hail detection network of 80 sensors distributed along the hail-hotspots in Switzerland. The network will be operated during the hailstorm season until 2025.
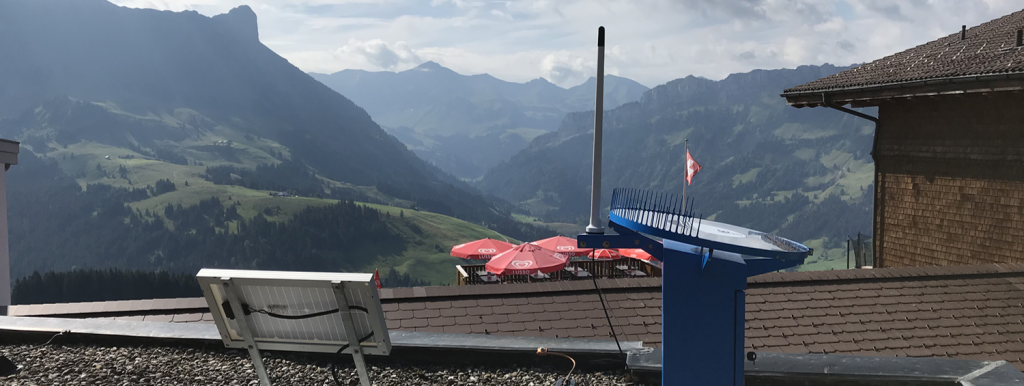
Finally, the last speaker of the innovation session, Dr. Martin Fengler, CEO at meteomatics, impressed us with some insights about the “meteodrone”, an vertical sounding product which meteomatics developed on their own.
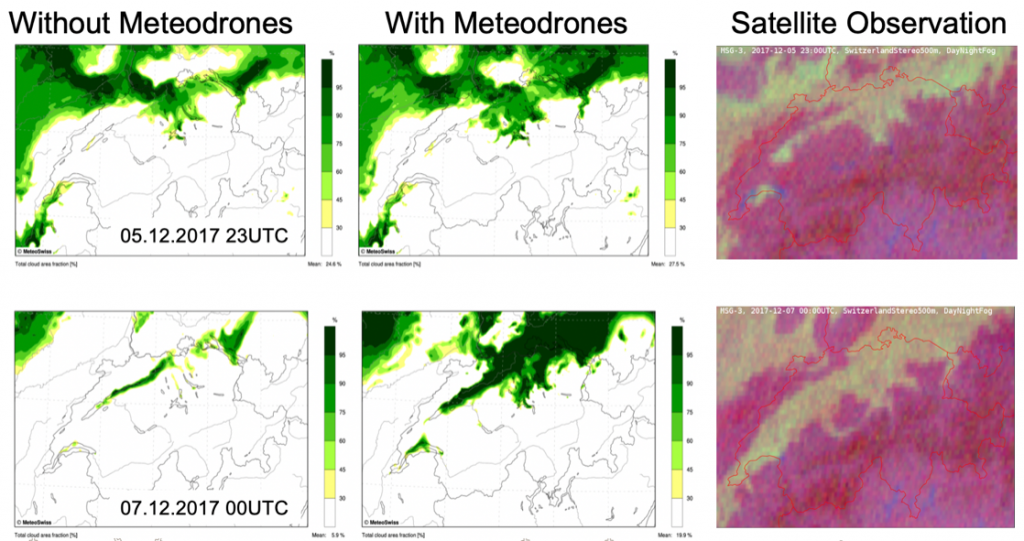
The idea emerged from an observation Martin did a few years ago: Too often, fog or thunderstorm forecasts were simply wrong. The reason behind this is – among others – attributable to observation data scarcity within the planetary boundary layer. The development of the meteodrone fills this market, providing a turnkey-solution allowing multiple vertical soundings to up to 6 km of altitude. Martin demonstrated the use of the meteodrones by comparing numerical weather forecasts with satellite observations: Cloudiness forecasts visibly improve significantly when nudging measured vertical drone soundings. Within the “DETAF 2.0” project, 15 drone sounding stations will be installed in the Swiss midlands and prealpine regions within the next few years, possibly bringing the numerical weather forecast quality in Switzerland to an unprecedented level.
We thank all the speakers for their very interesting talks and are looking forward to organizing the next SGM event!