Navigation menu
- Education
- Emissions & Air Quality
- Infrastructure & Services
- Meteorology & Climate
- News
- Physical Chemistry
- Projects
- The Team
During the Silvester fireworks in and around Zürich, many of you probably noticed that the air became foggy at some point. This can be explained by particles, emitted from the fireworks, accumulating in the boundary layer and acting as condensation nuclei for water droplets, which together with the air moisture and temperature led to fog formation. Additionally, the larger emitted particles might have been directly contributing to the foggy appearance by hanging around as dust.
We at Metenvia are mainly interested in the very small particles contributing to air quality in the city. This is why we have a relatively extensive LDSA monitoring network in and around Zürich, which consists of three stations in the city of Zürich, one in each, Kloten, Opfikon, Brütten, and Rümlang, and three stations on the ZHAW roof in Winterthur. As you might remember from a previous blog about the Net4City project, LDSA stands for lung-deposited surface area, and has the unit µm2/cm3. It is the total surface area of ultrafine particles capable of penetrating furthest into the lungs and therefore is closely linked to health.
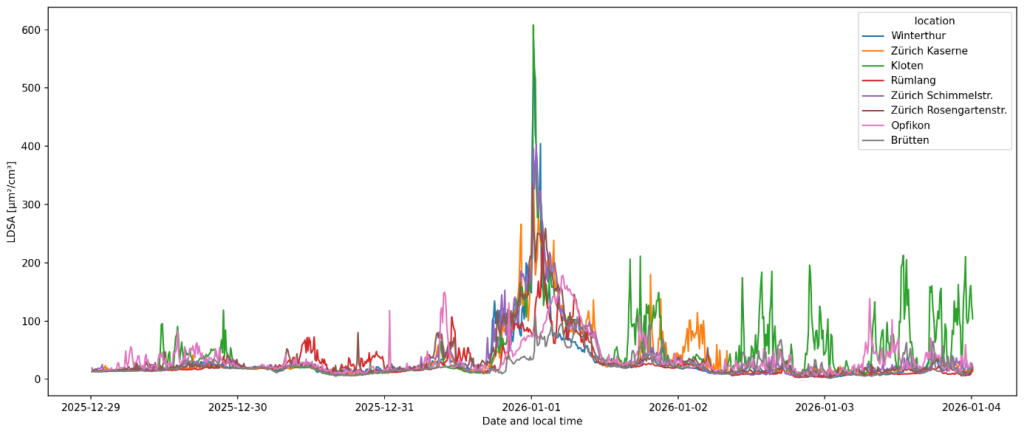
In figure 1 you can see the 10-minute mean measurements from the 29th of December to the 3rd of January, with the very clear peak in the night from the 31st to the 1st. While the peak is definitely centred around midnight on Silvester, there is already an increase in LDSA during the 31st and they also linger well into new years day. Likely because firework fans find it hard to wait until midnight and don’t want to stop when its over.
Now let’s see who had the biggest firework during Sylvester night! In figure 2 the houerly mean LDSA measurements for Winterthur, Zürich Kaserne, Kloten, Rümlang and Opfikon is shown, and for comparison the PM2.5 and PM10 (Particulate Matter) values measured by Ostluft (NABEL) at the station Zürich Kaserne. The highest LDSA values were measured at station Kloten and Winterthur, clearly followed by the stations in the city of Zürich, Rümlang and Opfikon don’t show the same midnight peak as the others but increase slightly later in the night. Similarly, the two PM measures don’t show a sharp peak around midnight but rather a steady increase starting in the evening of the 31st and reaching a maximum around 4:00 on the 1st of January.
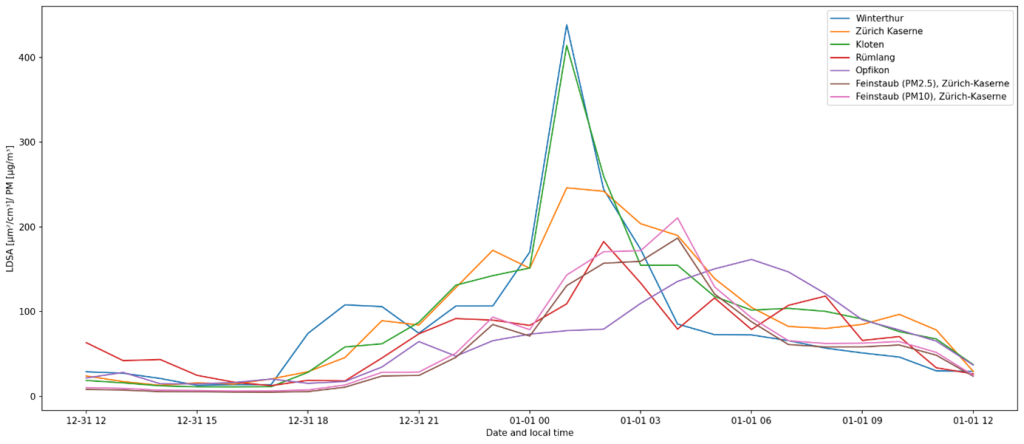
Obviously, we cannot infer from LDSA or PM directly to the size or number of fireworks. For example, the locations of the stations differ quite a bit, and the peaks of LDSA likely depend on the proximity to the emission source. For example, the Kloten station, with the highest peak, is about 4 meter over ground next to fields and a school on the boarder of Kloten. I could imagine this to be a place where people go to specifically to light their fireworks, due to its openness. In Winterthur on the other hand the station is located on top of a ZHAW building at Technikumstrasse, the elevated location of the station could place the station closer to the source of some fireworks. The, compared to Zürich, more concise city centre of Winterthur could explain why the LDSA peak is so much higher in Winterthur than in Zürich.
In Rümlang and Opfikon there are no distinct peaks around midnight, but the LDSA values increased in the hours afterwards. This is likely because the sources where not very close to the sensors, but particles were transported and accumulated over time. During the Silvester night a moderate south-westerly wind was prominent, which would place those stations more or less in the downwind region of Zürich, which would explain the slow and late increase in LDSA.
Comparing the LDSA measurements to the PM measurements at the Zürich Kaserne station we can see that the peak of LDSA occurs earlier than the PM peaks. While the absolute size of the peaks is not comparable due to the different units, the timing is. LDSA seems to respond to the firework emissions quicker, at least when close to the source, while the PM measures are a bit more delayed, likely due to an accumulation over time. The high LDSA peaks are also very short lived, indicating that LDSA is quite localised and variable in space.