Navigation menu
- Education
- Emissions & Air Quality
- Infrastructure & Services
- Meteorology & Climate
- News
- Physical Chemistry
- Projects
- The Team
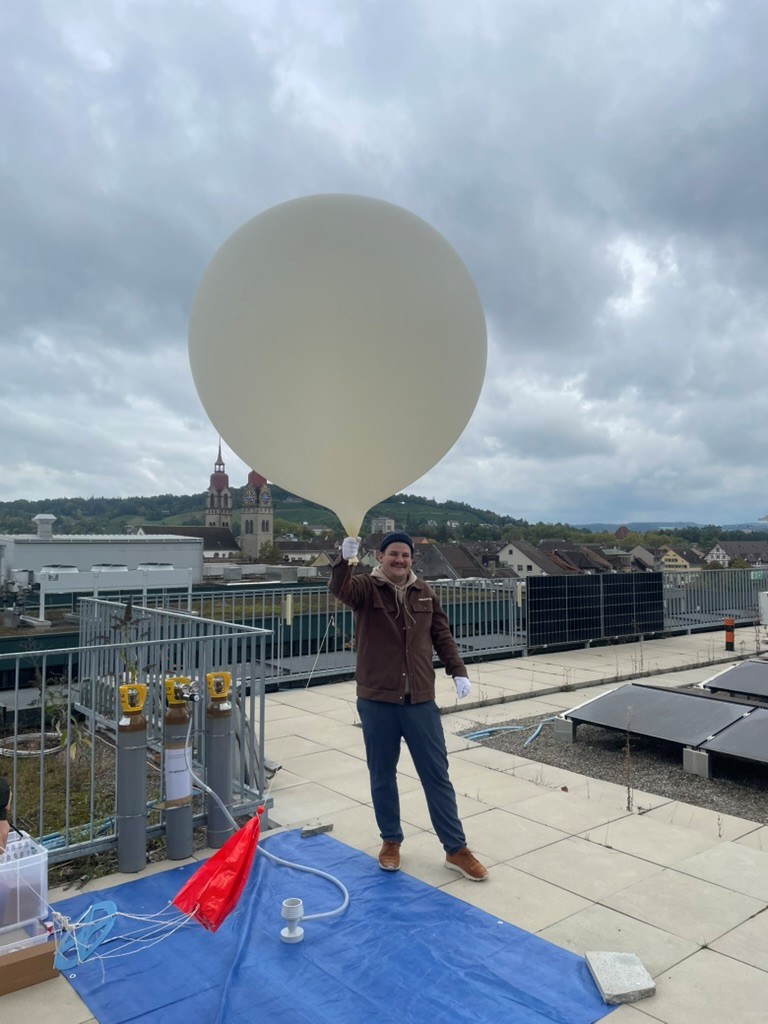
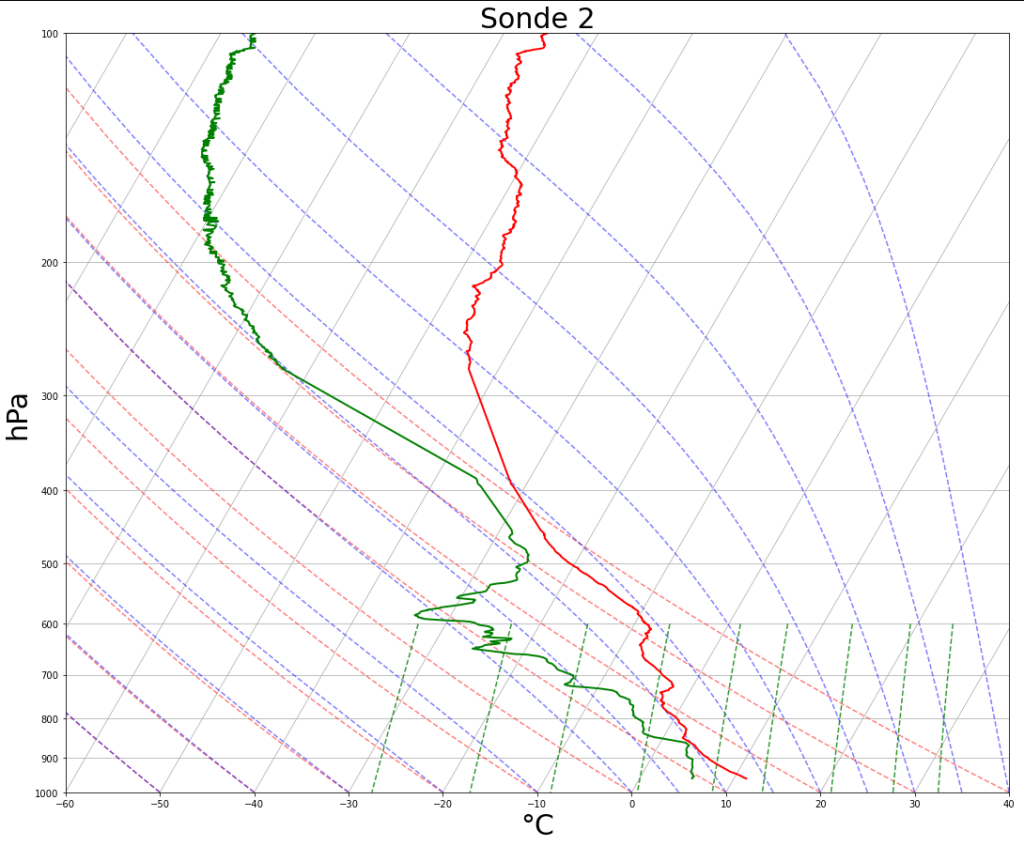
As part of the Atmospheric Physics and Applied Meteorology course for Aviation studies at ZHAW, we carry out a vertical sounding of the atmosphere during lab hours. A radiosonde is attached to a weather balloon which then ascends through the atmosphere, measuring temperature, moisture, pressure, altitude, and its location along the way. As the balloon rises and environmental pressure decreases, the helium inside expands and as a result its size increases until the ballon eventually bursts, usually between 30 to 35 km altitude. A small parachute is also attached to the radiosonde to slow it on its way back down. In the sounding shown in figure 1, a maximum altitude of 33’616 meters was reached before the balloon burst. Horizontally, the balloon traveled from the roof of ZHAW in Winterthur towards the northeast into Germany reaching the maximum height near Ravensburg and coming down somewhere near Biberach an der Riß. Figure 2 the temperature (red) and the dewpoint temperature (green) profiles of the sounding is shown. Can you detect the cloud layer at 850 hPa? If not, check out this guide from wildcard weather (link: https://wildcardweather.com/2015/02/21/learn-to-read-a-skew-t-diagram-like-a-meteorologist-in-pictures/).
Atmospheric soundings are an important instrument to gather data about the vertical profile of the atmosphere. This data is needed to get accurate initial conditions at higher altitudes for weather forecasting models and climate models. To this aim over 600 stations exist globally releasing a weather ballon every 12 hours at 00 UTC and 12 UTC. In Switzerland the Atmospheric soundings by Meteosuisse are done at the automatic measuring station in Payern. By participating in a sounding themselves the students get a unique insight in meteorological measurement technics. And hopefully gain a better understanding of the often discusses soundings and skew-T log-P diagrams they interpret during lectures and lab hours.
In a second experiment the students measured the local wind field in Winterthur using a theodolite and a pilot balloon. Pilot balloons are usually red for better visibility and much smaller than weather balloons. Because this experiment involves no automatic measurements it was done in groups of at least three students to account for the different tasks that need to be completed at the same time. As the balloon rises one student follow it visually with the theodolite, another student reads the elevation angle and the azimuth angle for every time step from the theodolite, and the third student notes the angles down and keeps track of the time. With this information and the buoyancy, the horizontal wind at each height can be calculated. This method is rather old and not used on a regular basis anymore as modern tools have replaced it. Nevertheless, it is an interesting, and hands on way to measure the local wind field.
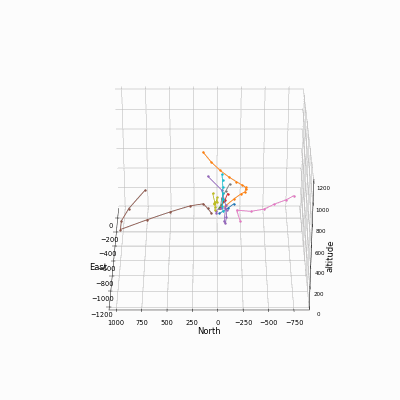
In figure 3 you can see the trajectories of the balloons of each group. The measurements were done between 10.15 and 13.30, which is a relatively long timeframe. In the morning low clouds obstructed most of the sky limiting the measurements to 200-300 meters (visible as the very short trajectories). Later in the day the clouds cleared up leading to much more extensive measurements of the wind field.
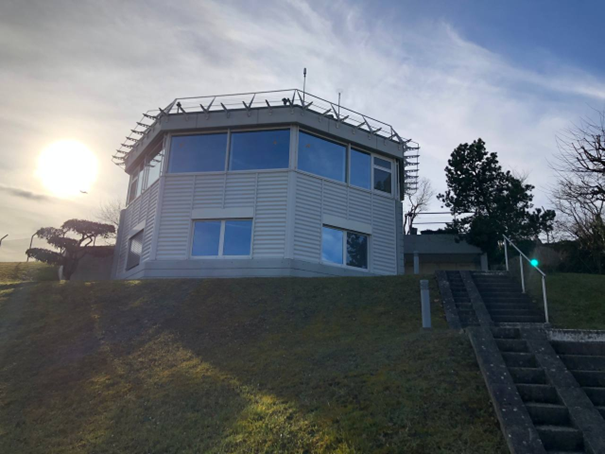
After concluding the course, some interested students went on an excursion to the meteo-facilities of MeteoSwiss at the airport of Zurich. A guided tour brings them to the measurement field between runway 16 and 14, and to the observation tower (shown below), were the aeronautical meteorological observers work. Based on the in-situ measurements and the observations of the aeronautical meteorological observers, the METARs (Meteorological Aerodrome Reports) are broadcasted every 30 minutes. The last stop of the tour is the forecasting office of MeteoSwiss at their headquarters, where forecasts and warnings for aviation but also other sectors are made around the clock.