Navigation menu
- Education
- Emissions & Air Quality
- Infrastructure & Services
- Meteorology & Climate
- News
- Physical Chemistry
- Projects
- The Team

“How warm is it today?”, you may have asked yourself, before walking out of the door. Indeed, knowing the approximate air temperature will steer many of your decisions: Hobbies, choice of clothing or even comfort-oriented decisions to turn up the heating.
As with many other questions in atmospheric physics, the devil lies in the detail. While measuring the approximate outside air temperature is literally a child’s play, performing automatic, unattended, World Meteorological Organization-conform measurements is extremely challenging – especially during daytime. Why is that?
Assume you are exposing a simple mercury thermometer to the outside air. If it is sunny, and if your thermometer is installed on the southern side of a building, you will be most likely reading values which are higher than the real air temperature. On the other hand, on a cold, snowy, but sunny winter day, installing the thermometer on the northern side of the house just above the ground will yield values lower than the real air temperature.
Meteorologists therefore often rely on “weather huts”. Earlier, these huts were mostly wooden, painted in white, and fitted with ventilation openings. Automatic temperature (and humidity) measurement devices, so-called hythergraphs, rather bulky back in the past, were installed in the hut. An ingenious mechanism was drawing the temperature measurement onto a continuous roll of paper. This allowed a relatively exact measurement of the temperature, especially due to two features: 1) The white paint on the weather hut reflects most of the incoming solar radiation, therefore staying relatively unaffected by solar radiation; 2) The ventilation openings allow outside air to flow through the weather hut, enabling a precise measurement of outside air temperature (and humidity).
Nowadays, reference temperature measurement devices mostly have their own ventilated casing called radiation shield. A fan often blows hundreds of liters of outside air per minute over the temperature sensor so air does not stagnate and warm up around the sensor. Together with the white (reflective) radiation shield holding off the warming solar energy, this setup allows very precise measurements in the order of +/- 0.1 K.
For measurement projects requiring the deployment of tens to hundreds of temperature stations, access to an external power source is not always available and/or feasible. However, powering the ventilator at least semi-permanently requires a decent amount of electrical energy. There thus remain two options: 1) Power the fan with a solar panel; 2) Remove the fan and rely on passive ventilation only. To increase the robustness of the station, many manufacturers (see Onset, Barani and Pessl solutions) choose to remove the fan while conceptualizing sometimes very ingenious radiation shields promoting natural ventilation, like the helical “MeteoShield” engineered by Barani Design Technologies.
Depending on the design, the passive radiation shielding can provide a good protection from solar irradiance, and the measurement errors can be reduced to values around +/- 1 K. Other designs are more simplistic, and we have experienced measurement errors of up to 6 K on very sunny, warm days on certain types of stations.
This can be very problematic if you depend on temperature measurements whose accuracy should be at least +/- 2 K or better. We therefore wanted to develop a radiation correction algorithm which allowed us to address the “radiation error” of different stations as much as possible. Among other meteorological and astronomical variables, the information regarding a station’s exposure to direct sunlight at a particular time proved to be the most important factor.
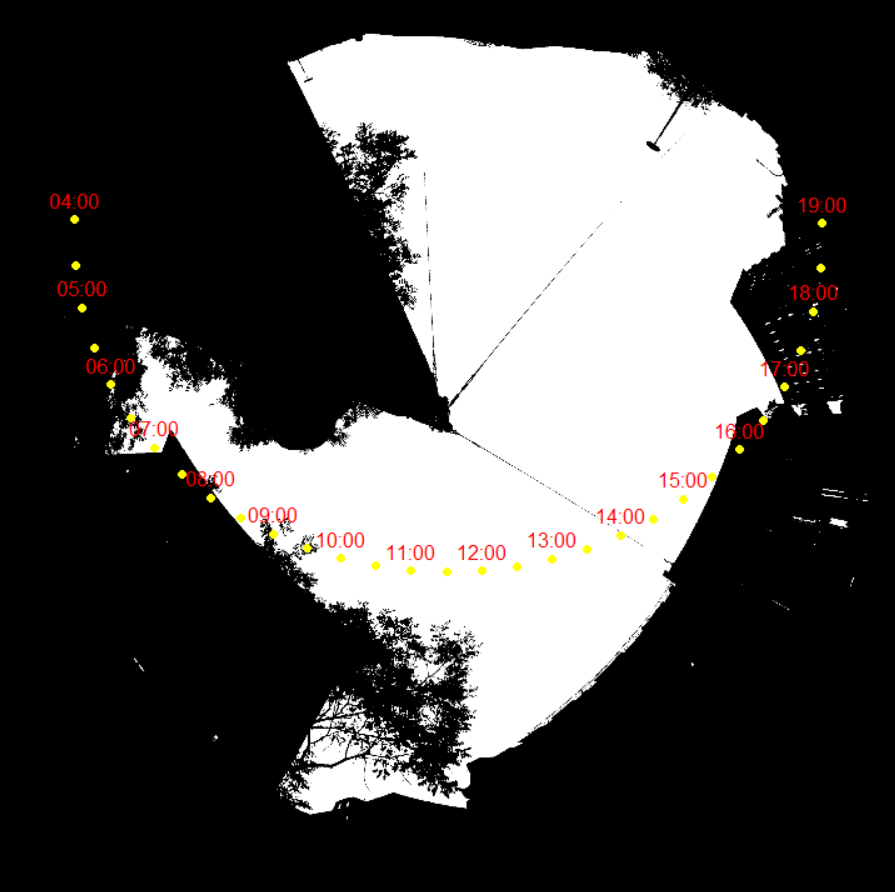
Focusing on the city of Zurich, where a network of 250+ stations was deployed over the course of three years, a routine was developed to automatically calculate the position of the sun relative to a station at any particular time. Among different algorithms, the shadow calculation based on hemispheric photos proved to be most useful, and is illustrated in figure 1.
For that, a GoPro 360° camera was used to take hemispheric pictures of the surroundings of the station. Then, the image material was georeferenced and reoriented to geographic north, before an image processing algorithm classified obstructed (black areas in fig. 1) from unobstructed (white areas in fig. 1) view to the sky. This allowed the calculation of a 10-minute resolved “sunview” dataset, informing us if a station was exposed directly to the sun or not. The shadow detection method is based on the work of Honjo et al. 2019 (doi: 10.2480/agrmet.D-18-00027 ).
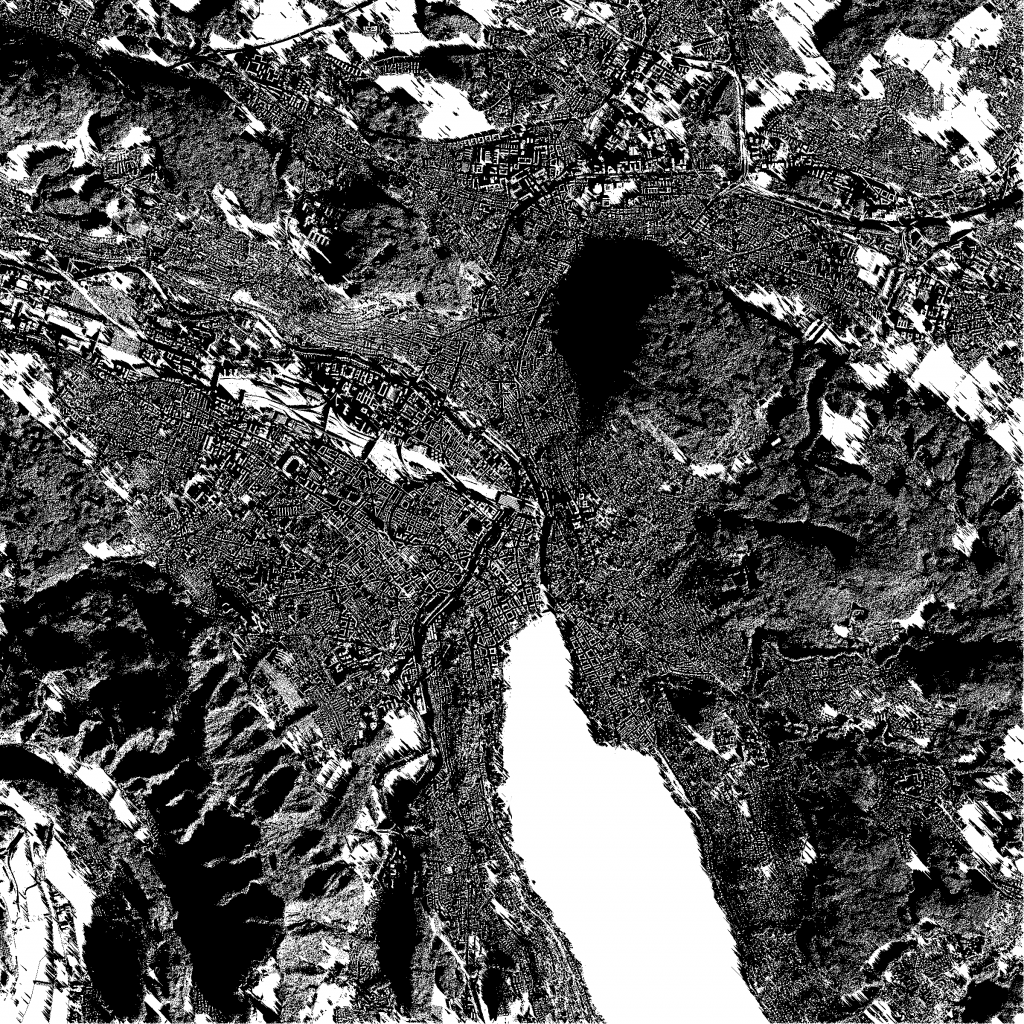
At all locations where no hemispheric photos could be done, we relied on a fallback option from a shadow detection product based on a 3D GIS-product (“3D-Dachmodell LoD2” from Zurich City, CC0). With the “UMEP” QGIS add-in (Lindberg et al. 2017, doi: 10.1016/j.envsoft.2017.09.020), a binary shadow dataset with 5m resolution was calculated for an entire year in 15 minute steps (see Figure 2).
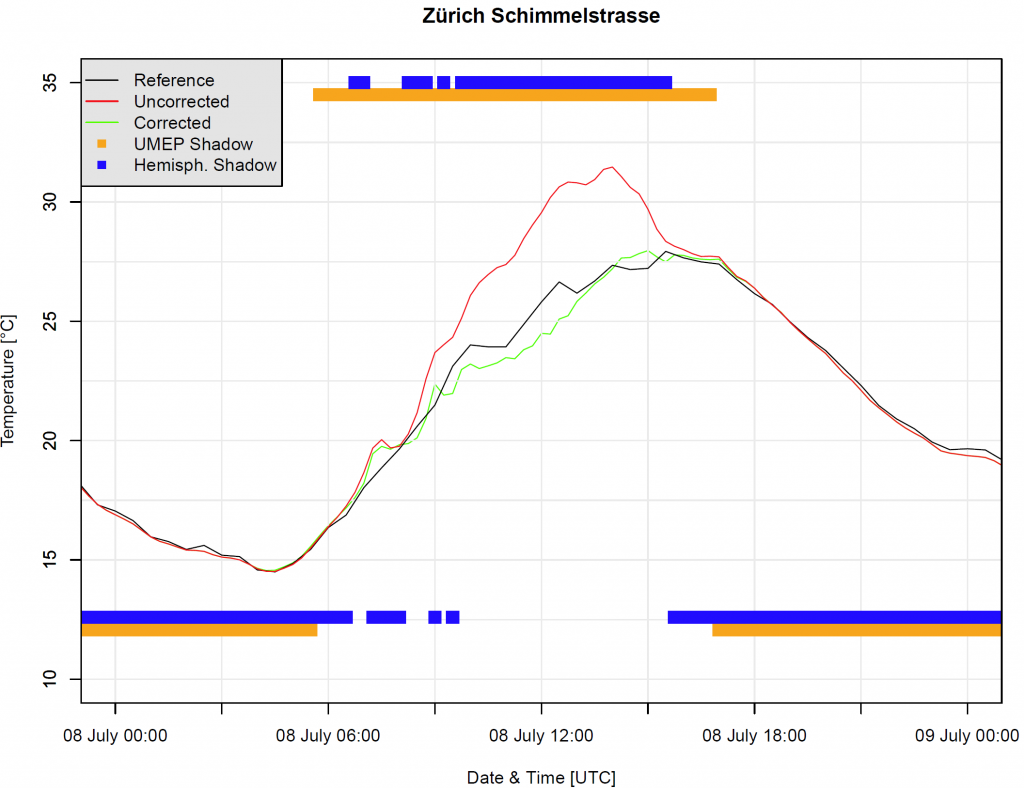
A linear model was then fitted to the station error (10 “training” stations) using – among others – the shadow information, the average incoming solar radiation and the wind speed as predictors. The result is illustrated in Figure 3, where the black curve illustrates the reference temperature measurement, the red curve the uncorrected temperature measurement and the green curve the corrected temperature measurement. Using the station “Schimmelstrasse” as an example, our method is able to decrease the root mean square error from 1.16 to 0.39 K. The algorithm is far from perfect, and more work needs to be done. However, the preliminary results are encouraging and confirm to us that we may be on the right track.