
Drew Conway´s data science Venn diagram is used by many (including me) to give a first impression of what data science is all about. And rightly so: I, for example, like it for its simplicity and “coolness”.
When in a more in-depth discussion, moving from mere buzz to concrete skills and project possibilities, we at the Datalab have gained good experiences with the following “skill set map”:
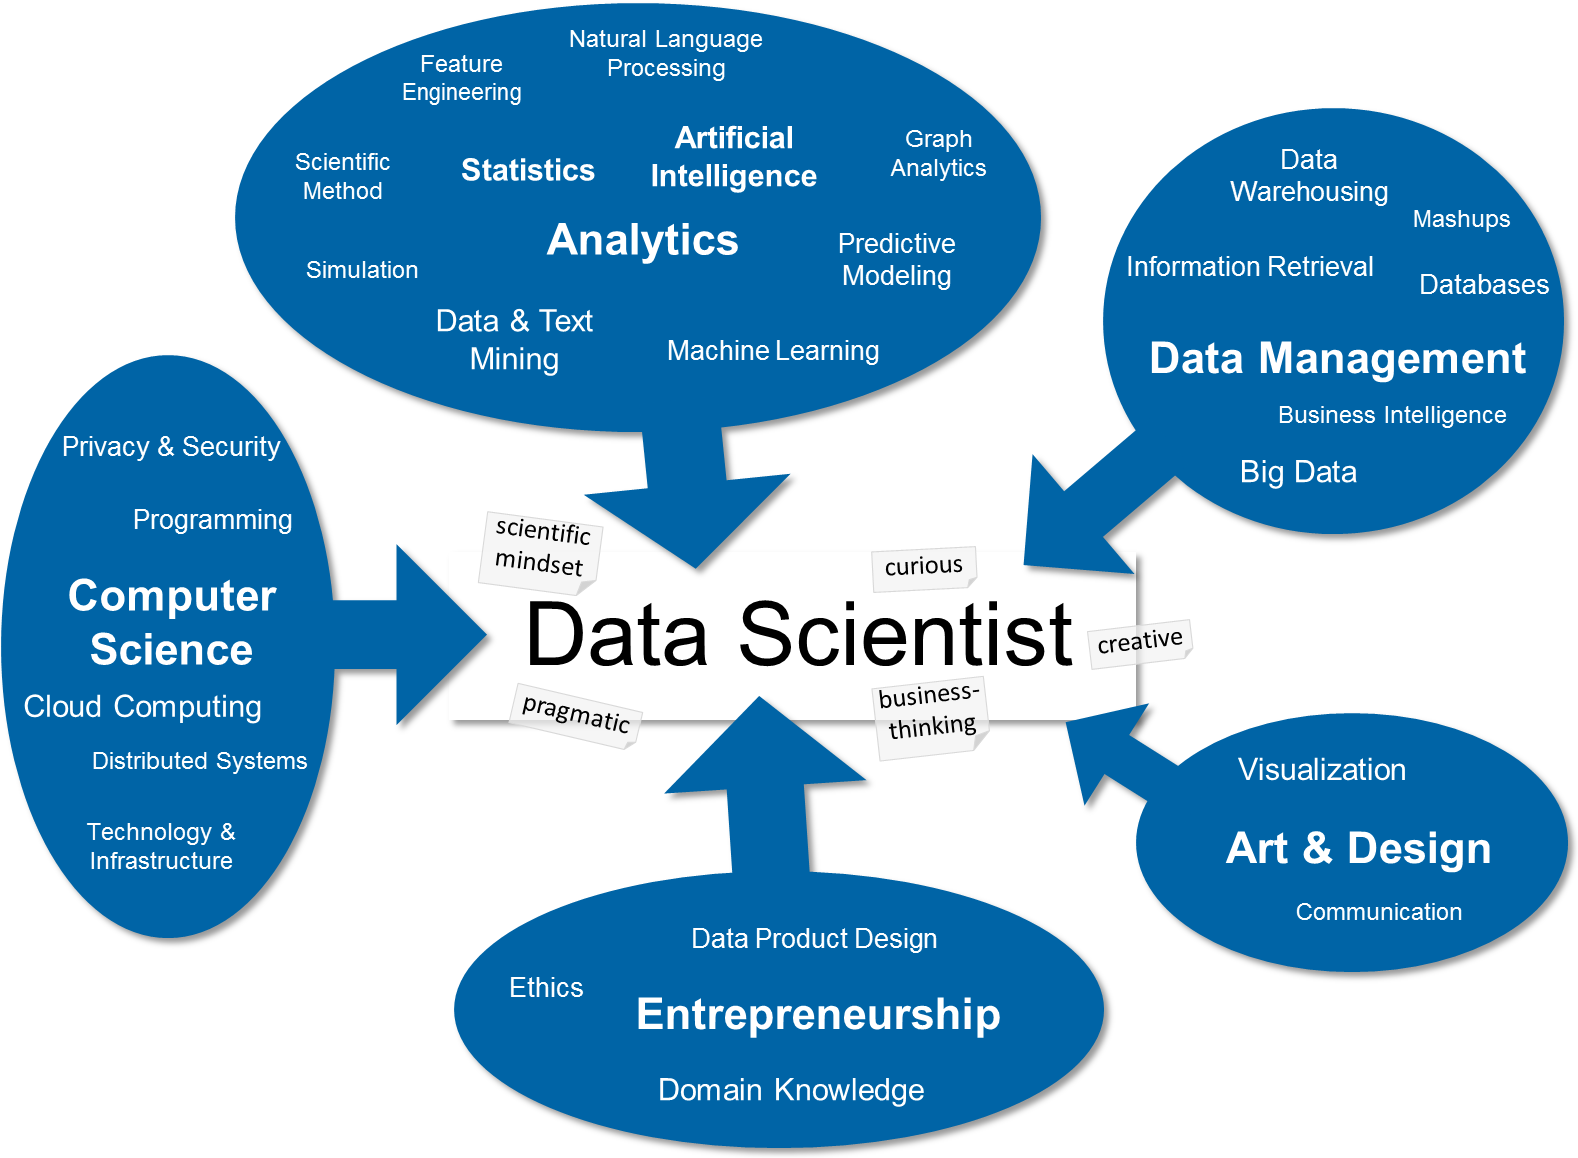
For us, it is a very useful (and used) tool to explain what data science is and what we can do:
- First, it shows the different hig-level skills a data scientist should master. This unveils the intrinsic interdisciplinarity of data science (I usually say that an actual data scientist should comprise approximately 80% of these skills, scattered over all 5 blue bubbles). These skills can be trained, usually by earning a degree in one of the top 3 bubbles (with a focus on quantitiative analytics) and getting skills in the other bubbles by interdisciplinary work and/or advanced training.
- Second, it shows character traits of a data scientist as grey labels attached to the center of the map. These attitudes are hard to train, but reveal the mindset of a data scientist.
- Third, the history of the field shows up on the map: all the skills have been developed in disciplines of their own right (like, e.g., statistics or artificial intelligence). Data science now is a unique blend of these skills (from analytics, engineering and communication) aiming at a specific goal: generating (corporate and/or societal) value from (all kinds of) data.
More Information on this skill set map and how we implement it within the Datalab can also be found in our paper “Applied Data Science in Europe“.
1 Kommentar
Comments are closed.